|
|
|
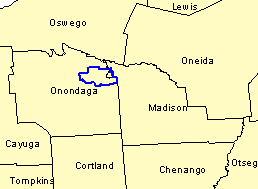
Attendance Area Demographics: Improving Educational Programs East Syracuse-Minoa School District, NY The East Syracuse-Minoa, NY school district is located in Onondaga and Madison Counties, New York as shown in the graphics presented below. Examples of the attendance area maps and demographics for the four attendance areas comprising the East Syracuse-Minoa, NY school district are reviewed in this Web page. The East Syracuse-Minoa school district has enrollment of approximately 4,000. These examples show how smaller districts can benefit from the availability of attendance area demographics equally as with larger districts. 
The East Syracuse-Minoa school district is comprised of approximately 500 census blocks shown below. Proximity developed the four attendance area zones shown with blue borders. 
Using GIS software, related street map overlay (as shown in the following graphic), and district supplied hand-drawn maps and related descriptions, Proximity develops the attendance area boundary files. 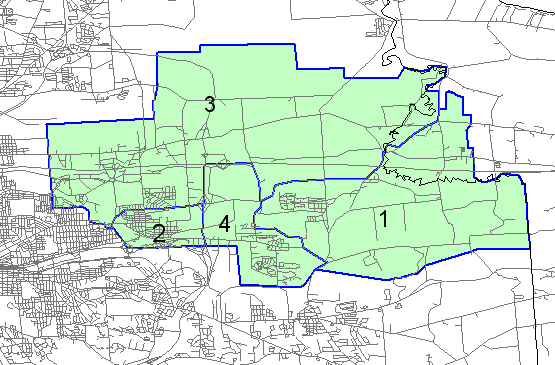
The attendance zones are then equivalenced to a group of contiguous census blocks or split census blocks. That is, each census block or split census block, is assigned a number corresponding to the attendance zone in which it is located. ESM attendance area zones (in the form of a polygon shapefile) may then be used as an independent map layer and combined with other types of geographic layers (e.g., streets, blocks, student locations). 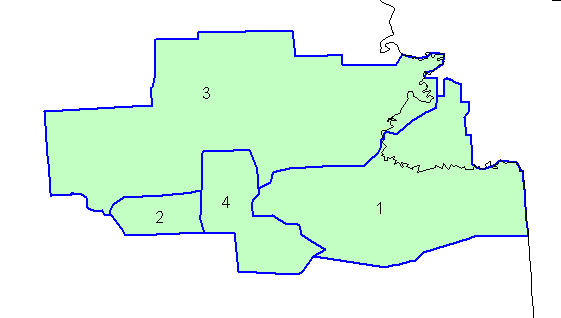
The zone-to-census block equivalence file is processed by specialized Proximity software that generates a custom district-wide attendance zone-by-zone spreadsheet profile. The spreadsheet contains a column showing the demographic characteristics for each attendance area and the district overall. A portion of the spreadsheet is shown in the following graphic. 
Data on single year of age by gender by attendance zone is shown further down in the spreadsheet as shown below. See the description of items included in this basic attendance area demographics spreadsheet at http://proximityone.com/dp2000et.htm. 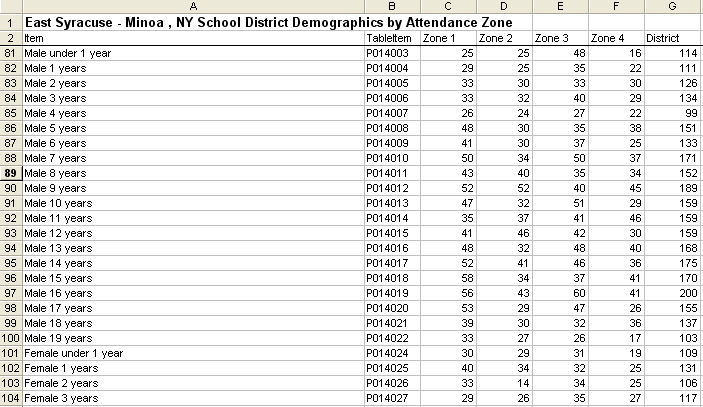
The single year of age by gender data may then optionally be used with the Proximity Modeler (http://proximityone.com/modeler/modeler1.htm) software. The Modeler software is used to generate current estimates and projections. [goto top] |
|
|