|
|
|
Examples of elementary school attendance areas maps and demographics for Arlington County Public Schools, Virginia are reviewed below. The 17 elementary school attendance areas are shown in the following thematic map. Click on this smaller map to view a larger version. 
The following partial spreadsheet views show the types of demographic data developed for each attendance area (the basic set of demographics include approximately 150 items). More detailed information on the scope of data is available at http://proximityone.com/dp2000et.htm. The following graphic shows the basic demographics for the attendance zone -- housing units, tenure, population by race/ethnicity, etc. summarized by elementary attendance area (only 4 attendance areas shown here). 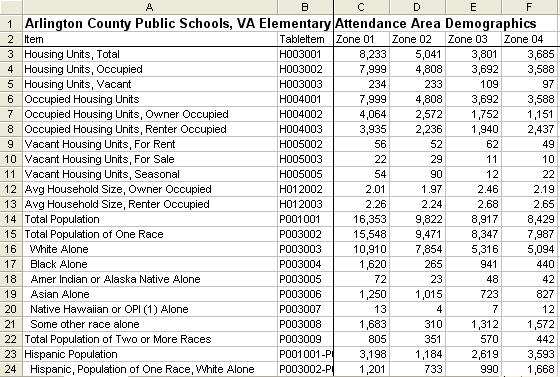
The following partial view shows the single year of age data by gender summarized by elementary attendance area. Using the single year of age data, age grouping can be summarized to match the attendance zone grade range. 
The following graphic shows the distribution of elementary school age children by elementary attendance area. Click on this smaller map to view a larger version. 
The following graphic shows the distribution of elementary school age children by census block with elementary attendance area boundaries as black outlines. Click on this smaller map to view a larger version. 
[goto top] |
|
|