
|
|
|
... data from American Community Survey 2013 Mandated by the 2008 Broadband Data Improvement Act, questions on computer and Internet usage are included in the American Community Survey 2013 for the first time. Initially computer and Internet usage data will be available from the ACS 2013 1-year estimates (September 2014). These estimates are available for areas 65,000 population and over; so the September 2014 data are available for the U.S. and all states, metropolitan statistical areas (MSAs), Public Use Microdata Areas (PUMAs), and 113th Congressional Districts as well as large cities, counties and school districts. Related data. Questions; Scope of Analytical Potential ... scroll section
The data are based on two questions:
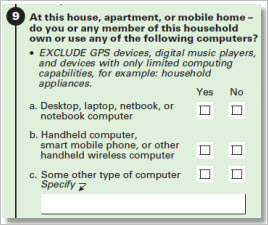  Applications The Federal Communications Commission (FCC) will use these data to measure the nationwide development of broadband access, as well as the successful deployment of the next generation of broadband technology. The data will also enable the FCC to develop measures to increase access to broadband technology and decrease barriers. The National Telecommunications and Information Administration (NTIA) will use the data to provide grants that help expand public access to broadband service and fund broadband education and support, particularly to groups that have traditionally underutilized broadband technology. State and local governments can use the data to evaluate access to broadband in their communities, and institute policies and programs that increase access to areas with less connectivity. Businesses, investors and other organizations can use the data to analyze computer and Internet usage in their markets and communities. Knowing how many people have access to computers and the Internet helps these groups communicate more effectively with their customers and plan outreach, infrastructure development, ecommerce and more. University researchers and other analysts have a wide range of new ways to examine the how, who and where of computer and Internet usage. Summary Data Available There are many new summary statistic tables based on the new questions. B28001 .. Types of Computers in Household B28002 .. Presence and Types of Internet Subscriptions in Household B28003 .. Presence of a Computer and Type of Internet Subscription in Household B28004 .. Household Income in the Last 12 Months by Presence and Type of Internet Subscription in Household B28005 .. Age by Presence of a Computer and Types of Internet Subscription in Household B28006 .. Educational Attainment by Presence of a Computer and Types of Internet Subscription in Household B28007 .. Labor Force Status by Presence of a Computer and Types of Internet Subscription in Household B28008 .. Presence of a Computer and Type of Internet Subscription in Household B28009A-I .. Presence of a Computer and Type of Internet Subscription in Household (By Race and Hispanic Origin) Related items are included in the Public Use Microdata Sample files and create many new possibilities to develop custom estimates of computer & Internet usage crossed by other population and housing attributes. Related Data The report Computer and Internet Use (May 2013) provides household and individual level analysis of computer usage and Internet use. The report is based on data collected in a July 2011 supplement to the Current Population Survey (CPS), which includes questions about computer ownership, Internet use both inside and outside the home, and the additional devices that people use to go online. The U.S. Census Bureau has asked questions in the CPS about computer use since 1984 and Internet use since 1997. The report provides limited scope state-level data and no sub-state data. Support Using these Resources Learn more about accessing and using ACS data integrated with other data; examine characteristics and patterns for your study areas and applications. Join us in a Decision-Making Information Web session. There is no fee for these one-hour Web sessions. Each informal session is focused on a specific topic. The open structure also provides for Q&A and discussion of application issues of interest to participants. Additional Information ProximityOne develops geographic-demographic-economic data and analytical tools and helps organizations knit together and use diverse data in a decision-making and analytical framework. We develop custom demographic/economic estimates and projections, develop geographic and geocoded address files, and assist with impact and geospatial analyses. Wide-ranging organizations use our tools (software, data, methodologies) to analyze their own data integrated with other data. Follow ProximityOne on Twitter at www.twitter.com/proximityone. Contact us (888-364-7656) with questions about data covered in this section or to discuss custom estimates, projections or analyses for your areas of interest. |
|
|