|
|
|
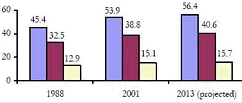
Impact of the Baby Boom Population Dynamics: Part I -- by Warren Glimpse and Catherine Wightman Reflecting in large part the baby boom population dynamics, the number of children 5-to-17 years of age will be flat nationwide, having little or no growth, or diminish in size for the remainder of the decade. By 2010, at 53 million population and approximately the same size as in 2000, this age group once again starts to increase at an annual rate of approximately one percent. By 2020, reaching 57.6 million population, this age group continues to increase annually but at a slower rate. These national trends will impact different school districts in different ways, but many districts will experience a slow-down in K-12 enrollment throughout the decade. 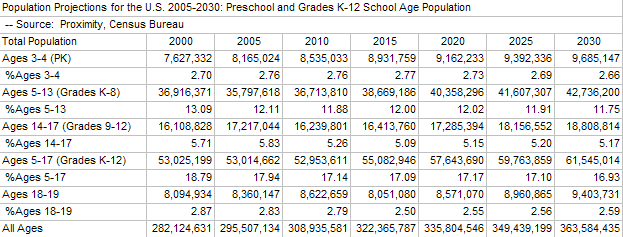
This brief is the first of a series on this subject to be released over the next few months. In part two, we will examine the implications of new state-level population projections to 2030. In part three, we will look at the impact of the baby boom on the 100 largest school districts. In part four, we will look at the impact on the broader school district infrastructure. Changing enrollments affect not only the local school district, but potentially the regional economic infrastructure. Federal and state spending patterns and levels change. Markets served by businesses change. Follow these briefs and learn more about your specific districts of interest. The baby boom population is generally defined as the population born between 1946 and 1964. The youngest members of the baby boom population are now in their early forties. Most of these younger baby-boomer families now have the last of their children starting to attend K-12 school. Over the next several years, many districts will experience a decrease in K-12 school enrollment resulting directly from a relative reduction in the number of children from baby-boomer households. Still other school districts will continue to grow rapidly as the result of other factors. Baby Boom Population and Sequels. The post-baby boom population (Generation X) is generally defined as the population born between 1965 and 1976. The echo boom population (Generation Y) is generally defined as the population born between 1976 and 2001. An older baby boomer parent may already have grandchildren in the 5 � 17 age group in 2005. Since the youngest baby boomers turned 40 in 2004, their last-born children are likely already in the 5 �17 age group, or soon will be. The baby boom through echo boom generations combine to make for a continuing annual increase in the total U.S. population in the year 2010 and beyond.
The impact of the baby boom population dynamics is only one factor that may affect the size and trends in any particular school district's enrollment. Changes in the location or size of business establishments and government operations can have a more dramatic effect. Population migration is another factor. But the impact of the baby boom is pervasive and warrants special attention. Updating National Scope K-12 Enrollment Projections. The most recent state-level K-12 enrollment projections were prepared by the U.S. National Center for Education Statistics (NCES).
Changing Demographics. Changes now taking place resulting from the aging baby-boom population and related household structural trends are now starting to affect enrollment patterns in some school districts. Here is a summary of a few key trends and factors. The proportion of married-couple households with their own children declined from 40 percent of all households in 1970 to 23 percent in 2003 (see details). In March 2002, 72 million children (defined as the population under 18) resided in the United States, up from 64 million in 1990. These children represented 26 percent of the U.S. non-institutionalized population, a proportion that was essentially unchanged from 1990 but down from 36 percent in 1960. This change is an important demographic trend, fundamentally related to the baby-boom cohort moving through the age structure and affecting the relative sizes of age groups (see details). Since the 1950s, the median age at first marriage has increased for both men and women, reaching 27 years for men and 25 years for women in 2003 (see details). State by State Population Projections by Age. See state-by-state population estimates and projections by age. This document and related links provide the first post-Census 2000 look at state projections of the population 5 to 17 years of age and controlled to Census Bureau projections. Additional Information Proximity develops geodemographic-economic data and analytical tools and helps organizations knit together and use diverse data in a decision-making and analytical framework. We develop custom demographic/economic estimates and projections, develop geographic and geocoded address files, and assist with impact and geospatial analyses. Wide-ranging organizations use our tools (software, data, methodologies) to analyze their own data integrated with other data. Contact Proximity (888-364-7656) with questions about data covered in this section or to discuss custom estimates, projections or analyses for your areas of interest. |
|
|