|
|
Jackson, MS MSA
| |
Decision-Making Information
|
| |
Contact Proximity for information
resources and solutions ...
(888) DMI-SOLN
(888) 364-7656
|
Situation & Outlook Terms of Use Main Page
The Jackson, MS MSA Situation Report provides a summary of the current demographic-economic situation and trends for this metropolitan area.
The Mississippi State capital metro, the Jackson, MS MSA ranks number 93 among all MSAs based on the latest official MSA population estimate (534,047).
Performance Indexes & Rankings. The S&O Composite Performance Rank for the Jackson, MS MSA is 194 among all MSAs.
Lay of the Land. The geographic vicinity and MSA component counties (see see county list) are shown in the map graphic. Click the toolbar MapView button to start/view the GIS project for this metro.
Population. The Jackson, MS MSA population changed from 498,280 in 2000 to 540,434 in 2008, a 8.46 percent change. The population is projected to be 620,670 in 2020, a 24.56 percent change between 2000 and 2020.
Population by Component County
| 2000 | 2000(%) | 2007 | 2007(%) | 2000-07 | 00-07(%) | MSA Total | 498,280 | 100.00 | 534,047 | 100.00 | 35,767 | 7.18 | Copiah County, MS (28029) | 28,768 | 5.77 | 29,317 | 5.49 | 549 | 1.91 | Hinds County, MS (28049) | 250,601 | 50.29 | 249,157 | 46.65 | -1,444 | -0.58 | Madison County, MS (28089) | 75,071 | 15.07 | 89,387 | 16.74 | 14,316 | 19.07 | Rankin County, MS (28121) | 116,183 | 23.32 | 138,362 | 25.91 | 22,179 | 19.09 | Simpson County, MS (28127) | 27,657 | 5.55 | 27,824 | 5.21 | 167 | 0.60 |
Population by Place
Principal cities | 2000 | 2000(%) | 2007 | 2007(%) | 2000-07 | 00-07(%) | MSA Total | 498,280 | 100.00 | 534,047 | 100.00 | 35,767 | 7.18 | Jackson, MS (2836000) | 183,742 | 36.88 | 175,710 | 32.90 | -8,032 | -4.37 |
Cities 20K+ population & 10%+ growth | 2000 | 2000(%) | 2007 | 2007(%) | 2000-07 | 00-07(%) | Brandon, MS (2808300) | 16,571 | 3.33 | 20,584 | 3.85 | 4,013 | 24.22 |
Population by Age
Age Group | 2000 | 2000(%) | 2007 | 2007(%) | 2000-07 | 00-07(%) | Total | 498,280 | 100.00 | 534,047 | 100.00 | 35,767 | 7.18 | Ages 0- 4 | 36,513 | 7.33 | 42,045 | 7.87 | 5,532 | 15.15 | Ages 5- 9 | 37,816 | 7.59 | 38,906 | 7.29 | 1,090 | 2.88 | Ages 10-14 | 38,575 | 7.74 | 38,981 | 7.30 | 406 | 1.05 | Ages 15-19 | 40,853 | 8.20 | 40,710 | 7.62 | -143 | -0.35 | Ages 20-24 | 37,310 | 7.49 | 39,962 | 7.48 | 2,652 | 7.11 | Ages 25-29 | 35,895 | 7.20 | 35,817 | 6.71 | -78 | -0.22 | Ages 30-34 | 34,850 | 6.99 | 34,664 | 6.49 | -186 | -0.53 | Ages 35-39 | 39,029 | 7.83 | 36,343 | 6.81 | -2,686 | -6.88 | Ages 40-44 | 39,407 | 7.91 | 36,851 | 6.90 | -2,556 | -6.49 | Ages 45-49 | 35,452 | 7.11 | 39,527 | 7.40 | 4,075 | 11.49 | Ages 50-54 | 30,127 | 6.05 | 36,848 | 6.90 | 6,721 | 22.31 | Ages 55-59 | 21,609 | 4.34 | 31,812 | 5.96 | 10,203 | 47.22 | Ages 60-64 | 17,705 | 3.55 | 23,285 | 4.36 | 5,580 | 31.52 | Ages 65-69 | 14,991 | 3.01 | 17,195 | 3.22 | 2,204 | 14.70 | Ages 70-74 | 13,535 | 2.72 | 13,527 | 2.53 | -8 | -0.06 | Ages 75-79 | 10,709 | 2.15 | 10,917 | 2.04 | 208 | 1.94 | Ages 80-84 | 7,073 | 1.42 | 8,419 | 1.58 | 1,346 | 19.03 | Ages 85+ | 6,831 | 1.37 | 8,238 | 1.54 | 1,407 | 20.60 |
Housing Units.
Market Value of Goods & Services. The per capita real gross domestic product (GDP) in this MSA changed from $33,044 in 2001 to $34,650 in 2006 (a 4.86 percent change). During the same period the all-U.S. MSA per capita GDP changed from $39,231 (2001) to $41,510 (2006), a 5.81 percent change.
Per Capita Personal Income. The per capita personal income in this MSA changed from $25,423 in 2000 to $32,287 in 2006 (a 27.00 percent change). During the same period the all-U.S. MSA per capita personal income changed from $31,474 (2000) to $38,564 (2006), a 22.53 percent change.
Housing Prices. The housing price index changed from 164.36 in the 2nd quarter 2007 to 167.63 in the 2nd quarter 2008 (a change of 2.79 over the one year period).
Labor Force/Employment/Unemployment. Employment changed from 248,717 in the 2nd quarter 2007 to 250,144 in the 2nd quarter 2008. During the same period, the unemployment rate changed from 5.20 to 5.53.
Industry Infrastructure. High level industry patterns.
High level industry establishments (UI covered)
| Establishments | 2008q1 | | Total | 13,094 | | Goods | 1,890 | | Nat Resources & Mining | 166 | | Construction | 1,287 | | Manufacturing | 437 | | Services | 11,204 | | Trans, Trade, Utilities | 3,235 | | Information | 212 | | Finance | 1,756 | | Professional/Business | 2,242 | | Education/Health | 1,418 | | Leisure/Hospitality | 1,142 | | Other | 1,199 |
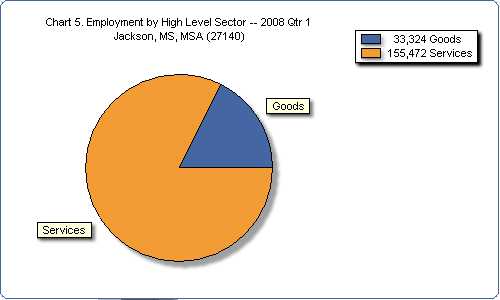
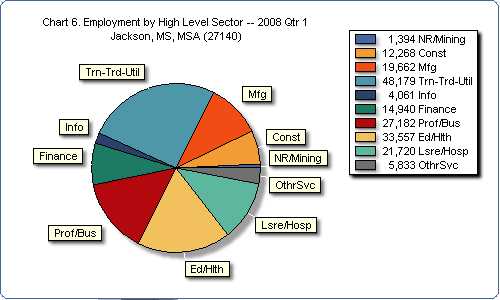
High level industry employment (UI covered, place of work in metro)
| Employment | 2008q1 | | Total | 188,796 | | Goods | 33,324 | | Nat Resources & Mining | 1,394 | | Construction | 12,268 | | Manufacturing | 19,662 | | Services | 155,472 | | Trans, Trade, Utilities | 48,179 | | Information | 4,061 | | Finance | 14,940 | | Professional/Business | 27,182 | | Education/Health | 33,557 | | Leisure/Hospitality | 21,720 | | Other | 5,833 |
High level industry average weekly wages (UI covered, based on employment by place of work in metro)
| Avg Weekly Wages | 2008q1 | | Total | 690 | | Goods | 815 | | Nat Resources & Mining | 846 | | Construction | 815 | | Manufacturing | 814 | | Services | 663 | | Trans, Trade, Utilities | 626 | | Information | 897 | | Finance | 1,042 | | Professional/Business | 862 | | Education/Health | 650 | | Leisure/Hospitality | 246 | | Other | 5,833 |
Recent high level industry infrastructure patterns based on employment.
School Districts and High Schools. Total 2006-07 K-12 school enrollment in the Jackson, MS MSA was 88,197. 11th grade enrollment was 5,232 and 12th grade enrollment was 4,553. School districts and high schools(12th grade enrollment of 25 or more -- see additional information) are listed below (school name, city, 12th grade enrollment).
Canton Public School Dist (Canton)
Canton Public High School | Canton | 136 |
Clinton Public School Dist (Clinton)
Clinton High School | Clinton | 297 |
Copiah Co School Dist (Hazlehurst)
Crystal Springs High School | Hazlehurst | 83 | Wesson Attendance Center | Hazlehurst | 61 |
Hazlehurst City School District (Hazlehurst)
Hazlehurst High School | Hazlehurst | 98 |
Hinds Co Ahs (Utica)
Hinds County Agricultural High Sch | Utica | 48 |
Hinds Co School Dist (Raymond)
Raymond High School | Raymond | 109 | Terry High School | Raymond | 234 |
Jackson Public School District (Jackson)
Bailey Magnet School | Jackson | 96 | Callaway High School | Jackson | 198 | Forest Hill High School | Jackson | 201 | Jim Hill High School | Jackson | 225 | Lanier High School | Jackson | 182 | Murrah High School | Jackson | 231 | Provine High School | Jackson | 181 | Wingfield High School | Jackson | 213 |
Madison Co School Dist (Flora)
Madison Central High School | Flora | 385 | Ridgeland High School | Flora | 158 | Velma Jackson High School | Flora | 87 |
Pearl Public School District (Pearl)
Pearl High School | Pearl | 177 |
Rankin Co School Dist (Brandon)
Brandon High School | Brandon | 238 | Florence High School | Brandon | 132 | Mclaurin Attendance Center | Brandon | 76 | Northwest Rankin High School | Brandon | 250 | Pelahatchie Attendance Center | Brandon | 45 | Pisgah High School | Brandon | 32 | Puckett Attendance Center | Brandon | 28 | Richland High School | Brandon | 68 |
Simpson Co School Dist (Mendenhall)
Magee High School | Mendenhall | 109 | Mendenhall High School | Mendenhall | 153 |
Copyright © 2009. All Rights Reserved. Proximity.
This document may be used by licensed users in the manner described it the license terms of use.
For additional information, contact Proximity -- (888)364-7656.
|