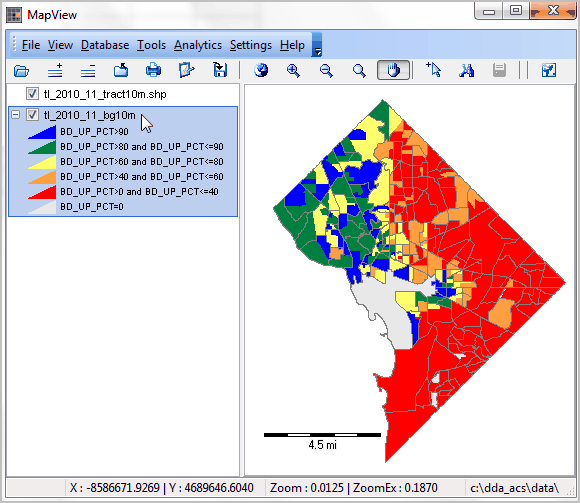
This section is focused on using the ProximityOne DDA_ACS Windows-based tools to access and use detailed census tract and block group demographic data from the American Community Survey (ACS) 2010 Summary Files. Use these tools to support the full range of data extraction, file building, data integration and pattern analysis. Create thematic maps like the one shown below right for Washington, DC.

Educational Attainment
Washington, DC
"Block Groups" are the smallest geographic areas for which "richer demographics" (e.g., income, housing value, educational attainment) are tabulated by the Census Bureau. View a list of tables for which BG demographics are available in the next section. "Tables" are organized sets of data items/cells (tabulations/estimates) for a particular subject matter theme or universe. For example, Table B16004 -- Age by Language Spoken at Home by Ability to Speak English for the Population 5 Years and Over (67) contains 67 data cells on this topic. Only here can data on this topic for neighborhood and sub-neighborhood areas -- covering the U.S. wall-to-wall. Unlike Census 2000, the Census Bureau now tabulates these data annually.
The Census Bureau published the ACS 2010 5 year estimates "tracts and block groups" summary files in December 2011. This section and the program "DDA_ACS" are focused on accessing, displaying and extraction, integration, and analysis of data from those summary files. ACS 2010 block group data are only available in these summary files.
DDA_ACS has two primary operations.
•ACS2010 Summary File (SF) data access, display and extraction
•MapView - a variation of CommunityViewer GIS
DDA_ACS is now available in a desktop standalone application only. Later in 2012, DDA_ACS will be integrated with the main DDA desktop application as well as the Web-based version of DDA.
DDA_ACS Quickstart
This quickstart provides a summary of steps to illustrate viewing and extracting block group data for Washington, DC and creating/using Washington, DC block group maps. Emulate these same steps for other states of interest.
This view of the study area has been developed using the DDA MapView tools. The MapView tools are broader than tracts and block groups; MapView can knit together tracts and BGs with other geography. MapView can be used to view shapefiles and other types of geographic files for any country, set of countries and the World.
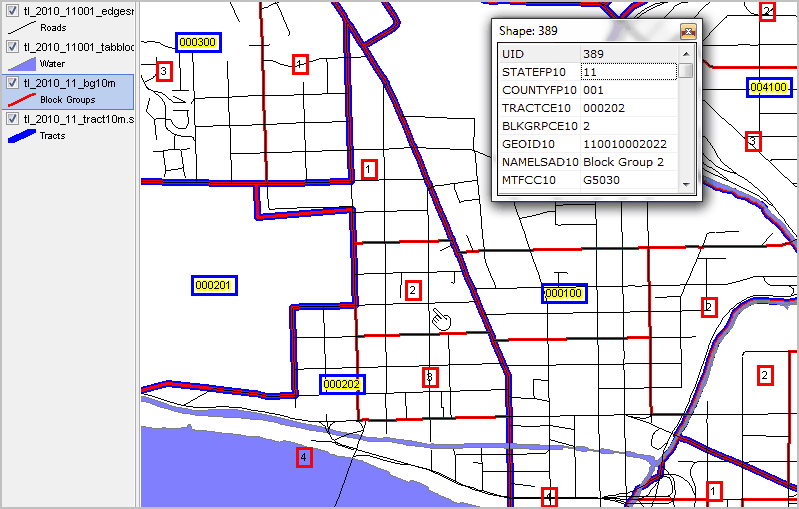
In the following view, Census 2010 census tracts are shown with bold blue boundaries (yellow labels, blue outline). Census 2010 block groups are shown with red boundaries (black label, red outline). Our study area is tract 000202. Identify tool (see pointer) used to click on a block group and show mini-profile. As shown in the view below, tract 000202 is comprised of 4 block groups. This is the "Georgetown" area of Washington, DC, located mainly north of M Street.
View Map of Study Area
|
Install DDA_ACS
Start DDA_ACS
Using DDA_ACS we have these objectives in this quickstart section:
1. View ACS 2010 demographics for a selected census tract and related block groups in Washington, DC
2. View that area in a custom map that enables viewing tract and block group boundaries with codes (above).
3. Extract ACS 2010 demographics by census tract and block group and merge with other data.
The ACS 2010 subject matter table loads at start-up and is shown in the upper left Subject Matter listbox.
Expand the ACS data zip file (one time operation)
For Quickstart, this part can be skipped. The setup places the ACS TBG (tract/block group) data for Washington, DC in your data folder, ready for use/next step. More in general, to use the ACS TBGdata, those data first need to be downloaded to your computer. |
Open a State by ACS Tract/Block Group Summary File
Use File>Open ACSSF Local to open the file c:\dda_acs\data\g20105dc.txt. (this has already been done; the file c:\dda_acs\data\g20105dc.txt is included with the setup.
Note that the state ACS TBG SF geography file is named like g20105SS.txt for each state where SS is the state postal abbreviation.
When local SF is opened, the lower left Geography listbox is populated. There is a row in the listbox for each census tract or block group. The geocode is shown at the left in the listbox string (11 characters for a tract; 12 characters for a block group. |
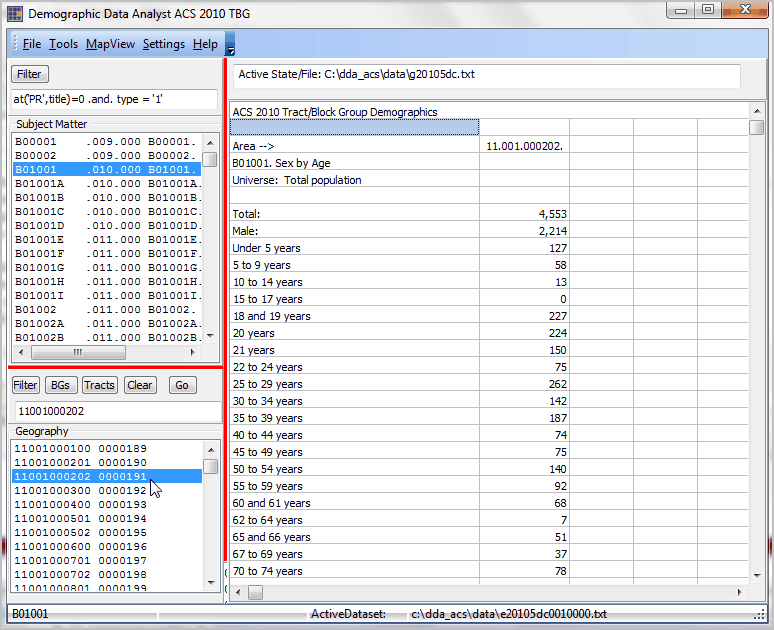
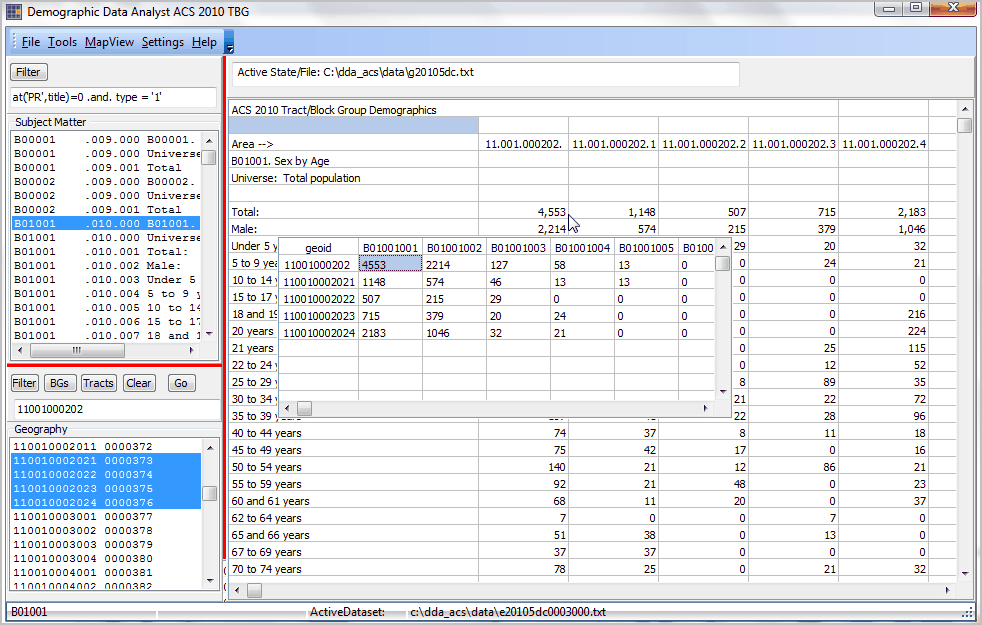
View Selected Table for Selected Geographic Area
Dbl-click the subject matter table B01001. Dbl-click the geographic selection 11001000202 (tract 000202 in above map view). Demographic table displays in grid at right.
|
View Selected Table for Group of Geographic Areas -- Census Tract and Component Block Groups
When this grid displays,
•the data are automatically exported in XLS, CSV and RTF formats in structure as shown in the grid.
•the data are automatically exported in a transposed manner creating a data file organized by area/geography.
Dbl-click the subject matter table B01001. Click Subject Matter Filter Button (preloaded with tract code of interest) Dbl-click the geographic selection 11001000202 (tract 000202 in above map view). Demographic table displays in grid at right.
|
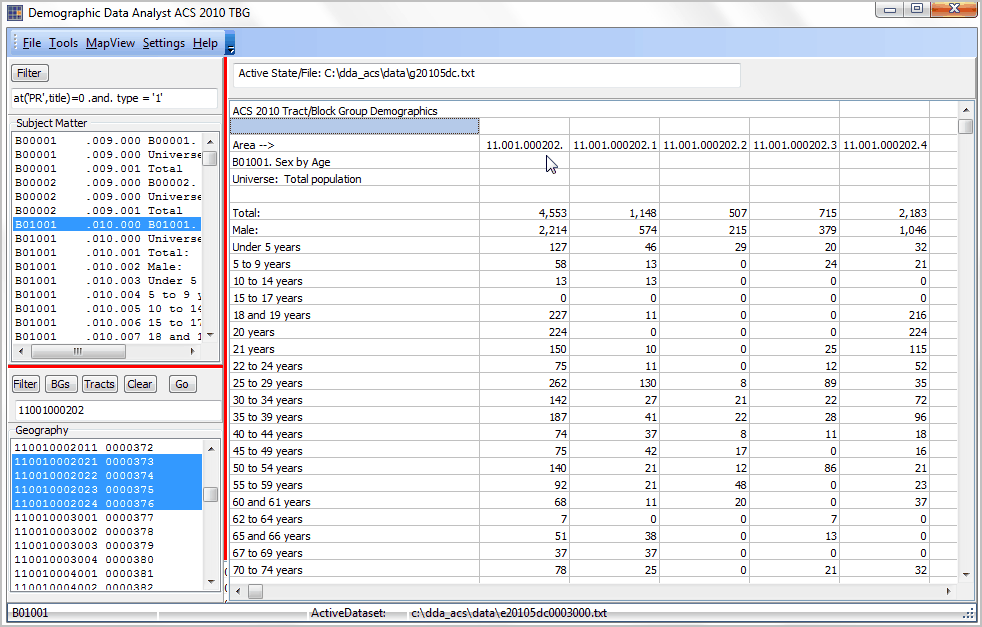
View Selected Table for Group of Geographic Areas -- Concurrent View with Data File Output
This example shows the data file grid embedded in the grid shown above.
|
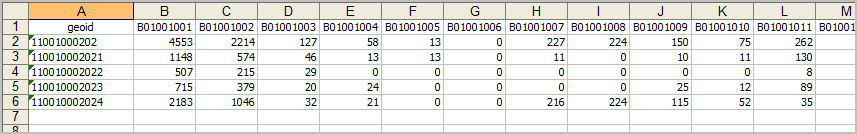
Data File Output - Exported to Excel
|
Building State by Block Group Data File
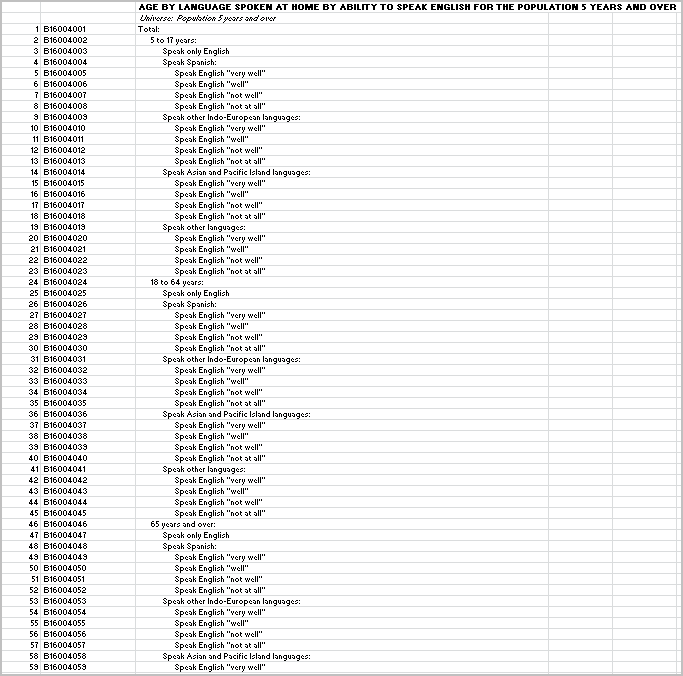
Table B16004 -- Age by Language Spoken at Home by Ability to Speak English for the Population 5 Years and Over (67)
Partial view of Table B16004 items (67 data cells for each BG). Full view via Help>ACS Table Shells XLS
|
Create D.C. by Block Group Excel File with DDA_ACS
The table is selected in the Subject Matter selections listbox (dblclick B16004 row). Click Geography listbox Clear button then BGs button ... all BGs in the state file are selected. Click Go and the file is generated (automatically exported to Excel and CSV)
|

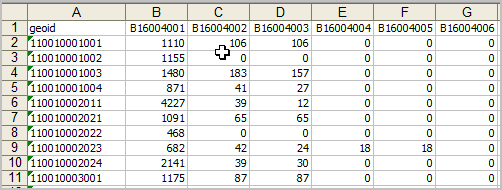
Extract Excel File is Automatically Created for All Block Groups
For geographic selections, click Clear button then click BGs button then click Go button. The all DC block groups Table B16004 Excel file is created (as named via Settings/INI). See the complete automatically exported Excel file -- http://proximityone.com/dda/acsfileb16004_dcbg.xls. To orient, column B is total population, column C is population ages 5-to-17.
|
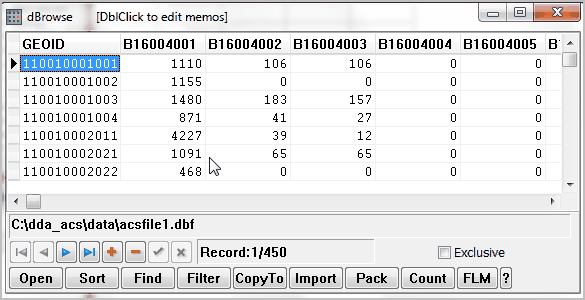
Extract dBase File is Automatically Created for All Block Groups
Optionally use DDA>dBMerge to merge the dBase file (subject matter dbf) generated with shapefile dbf.
The dBase file generated (named via Settings/INI) is opened/displayed using Tools>dBrowse (see below). Note ... if merging tract level subject matter file into tract shapefile, use substr(geoid,1,11) as key. The GEOID field is always structured as a 12 character field (to accommodate tract and BG geocodes). See the complete automatically exported dBase file -- http://proximityone.com/dda/acsfileb16004_dcbg.dbf. (to view, save to c:\dda_acs\data) and open with Tools>dBrowse)
|
Examining educational attainment patterns by block group in Washington, DC
Create a vision/objective for the mapping/GIS application.
One mapping/GIS use is for reference and orientation as shown above.
Another example is pattern analysis as reviewed below.
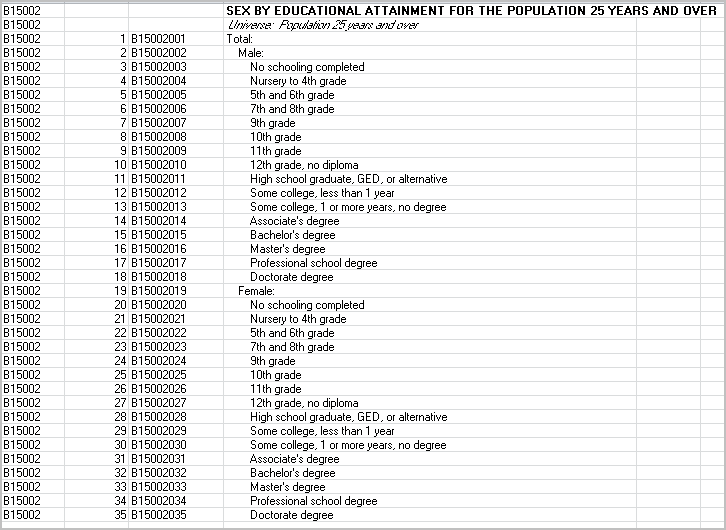
Step 1. Extract B15002 Educational Attainment -- DC by Block Group
Table B16004 items (35 data cells in this table). Access view of any table via Help>ACS Table Shells XLS
|
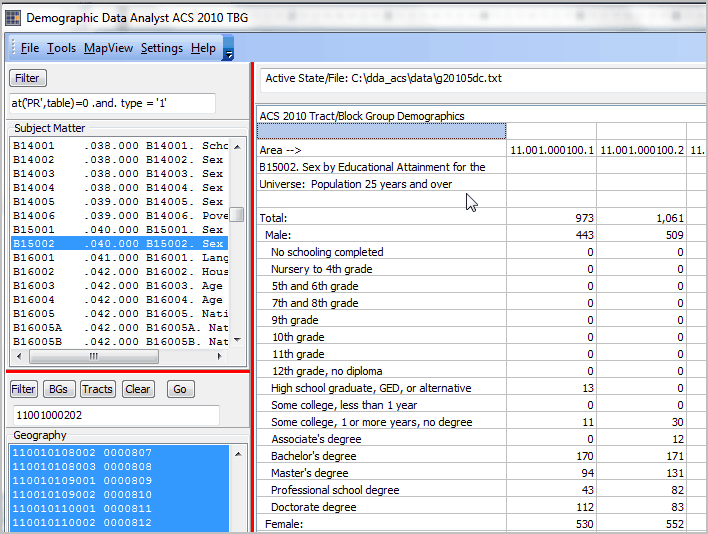
Create D.C. by Block Group File with DDA_ACS
Table B15002. Sex by Educational Attainment for the Population 25 Years and Over (35) is extracted using similar steps as described above for Language Spoken at Home.
|
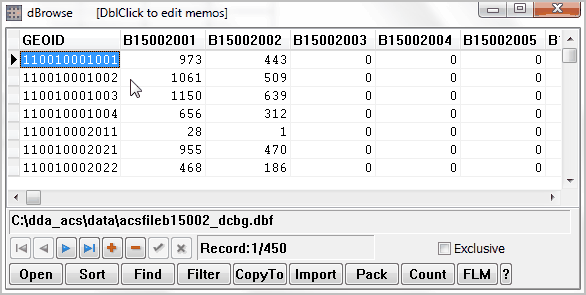
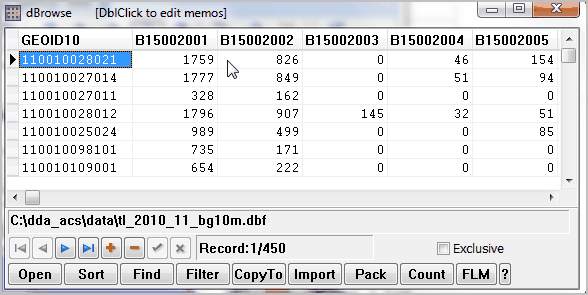
Extract dBase File is Automatically Created for All Block Groups
The dBase file generated (named via Settings/INI) is opened/displayed using dBrowse (see below). Note ... if merging tract level subject matter file into tract shapefile, use substr(geoid,1,11) as key. The GEOID field is always structured as a 12 character field (to accommodate tract and BG geocodes). See the complete automatically exported dBase file -- http://proximityone.com/dda/acsfileb15002_dcbg.dbf. (to view, save to c:\dda_acs\data) and open with dBrowse)
|
Step 2. Merge B15002 Subject Matter Fields with DC by Block Group Shapefile
With MapView running, use File>Close to close all files. The map window is now empty. Use Database>dBMerge to merge the B15002 subject matter fields into the DC by Block Group shapefile. The original shapefile dbf tl_2010_blockgroup10 is replaced with the original records/fields extended with addition of acsfileb15002_dcbg.dbf.
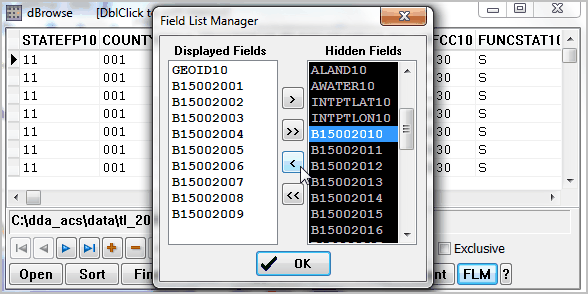
Shapefile dbf is opened using dBrowse ... selected fields for display using FLM feature.
dBrowse closed. New project developed for thematic map pattern view. |
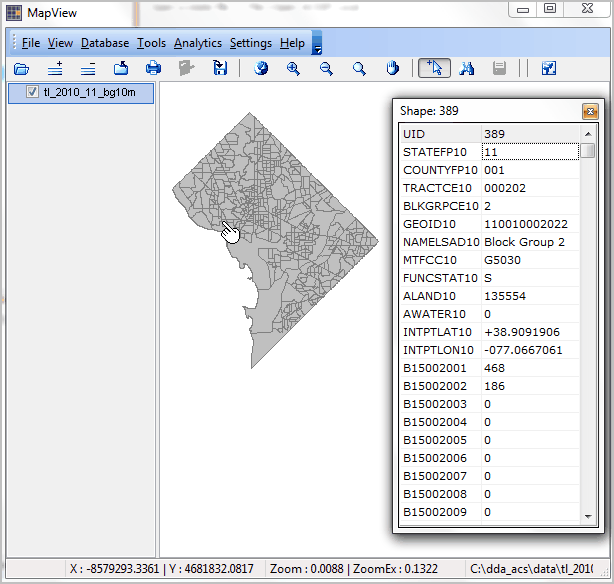
Step 3. New DC GIS Project Developed/Used
Developing the "DC2" GIS Project (included with setup). Using MapView, c:\dda_acs\dda\tl_2010_11_bg10m.shp shapefile is opened. The identify tool is used to click on a selected block group (see pointer) and display a mini-profile. The fields are those created in the merge process (above).
|
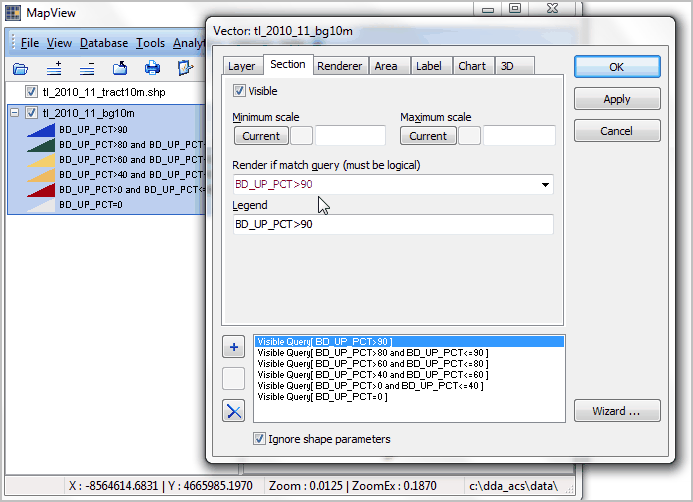
Step 4. "DC2" GIS Project BG Educational Attainment Layer Developed/Displayed
A layer is created with an SQL statement using the layer editor. Percent population 25 years and over with bachelor's degree or higher 100* B15002014+B15002015+B15002016+B15002017+B15002018 (sum of males for selected educational attainment levels - see table below) +B15002032+B15002033+B15002034+B15002035 (sum of females for selected educational attainment levels - see table below) /B15002001 (population 25 years or over - see table below)
In the next view, the new variables "BD_UP" and "BD_UP_PCT" (population 25 years and over with bachelor's degree or higher) have been computed and added to the shapefile dbf. This avoids the entry of the algebra in the SQL statement shown in the following examples.
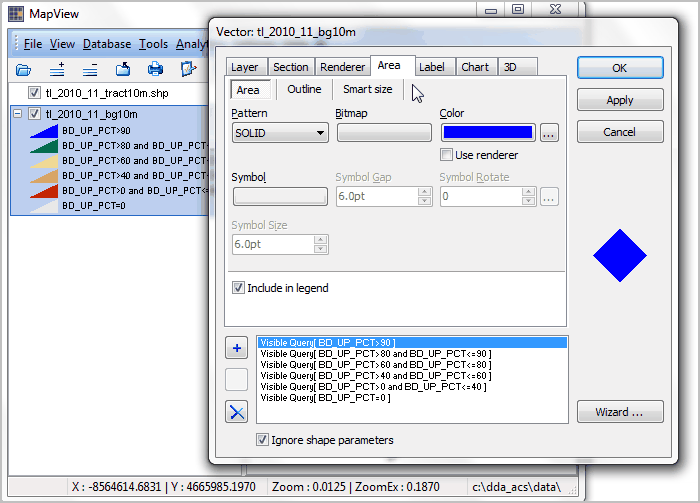
Layer Editor -- SQL Settings
Layer Editor -- Pattern Settings
|
Step 5. Analysis & Interpretation: Examining Pattern Views
Percent Bachelor's Degree or Higher: Washington, DC by Block Group (450 block groups) "DC2" GIS Project (included with setup)
|