

Rome City School District, NY |

|

|

|

|

|
||
Rome City School District, NY |
|
|
|
|

|

|
|
|
||
This section provides examples using the DDA Viewer for neighborhoods in the Rome City School District, NY.
See related section in Applications Gallery -- http://proximityone.com/gallery/guide/ny_rome.htm
Developing insights ... examining demographic patterns and change by neighborhood.
... see how demographics of a multi-tract study area (as an example) changed between 2008 and 2010.
... examine "richer demographics" based on the ACS 2010 data not available from Census 2010.
... examine/compare/contrast attributes of individual tracts.
... examine demographics for total area and how the population is changing.
The CommunityViewer (CV) GIS software (http://proximityone.com/cv.htm) site analysis tool is used to select geography for analysis in the DDA Viewer. Census tracts are used in this application.
The geographic area codes are saved to a file that is then processed by DDA Viewer.
Using CommunityViewer GIS
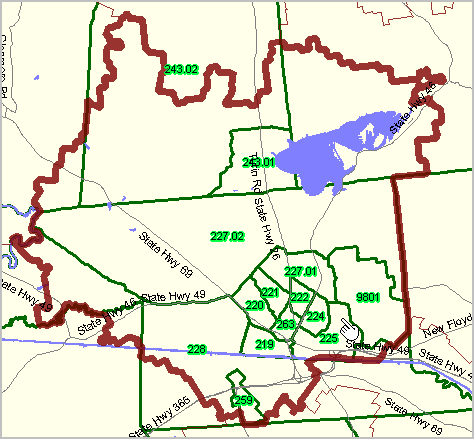
A CV GIS project is opened. The following project view shows the boundary (bold brown) of Rome City School District, NY located in Oneida County. Census 2010 census tracts are shown with green boundaries and tract code labels.
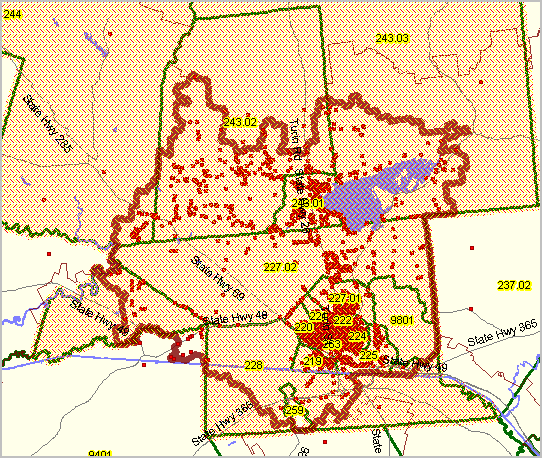
The next view shows tracts selected (cross-hatched) using CommunityViewer GIS. Students shown as red markers. Tracts labeled with census tract code.
 dir sel*
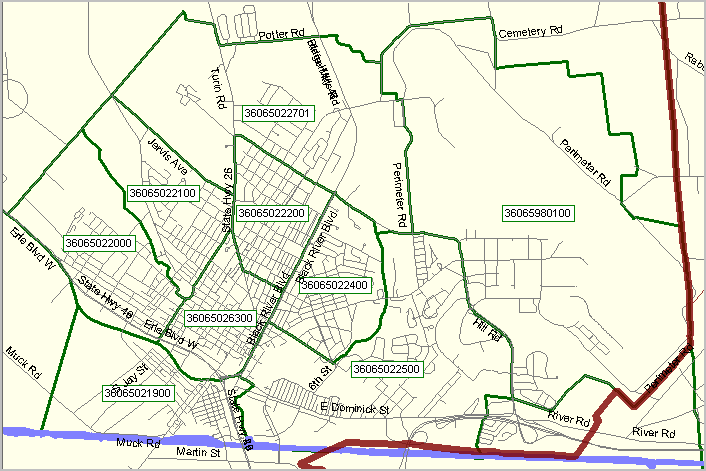
Zoom-in view with streets without tract selection crosshatching.
Using DDA
CV is closed. DDA is started. Viewer is started.
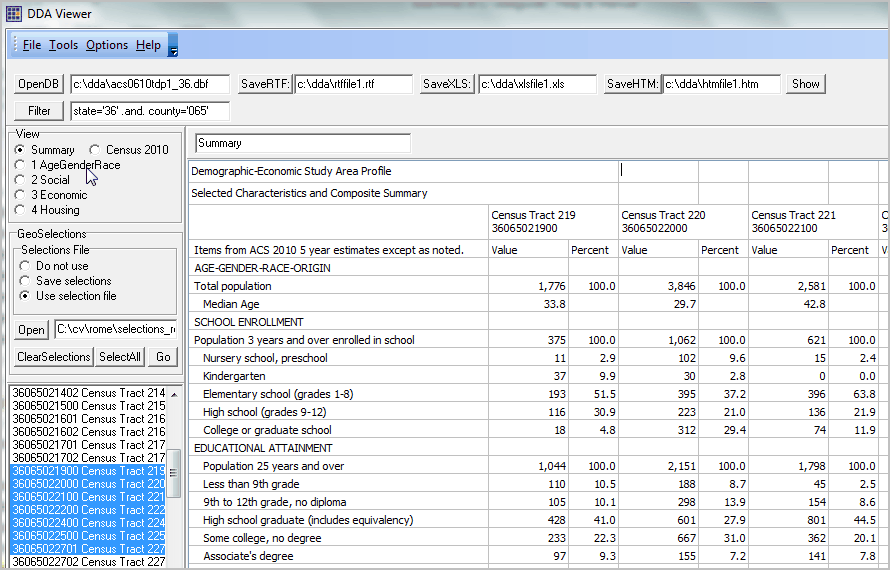
The following operations are shown in the graphic presented below.
The DB is set to c:\dda\acs0610tdp1_36.dbf (all New York census tracts) and opened (click OpenDB).
A filter is applied (state='36' .and. county='065') and applied (click Filter).
A Selections file is used (created by CV) and Use selection file radiobutton is clicked.
The specific selections file c:\cv\rome\selections36065.dbf is opened.
The Go button is clicked; DDA generates six demographic profiles.
Part of the summary profile is shown in the grid.
The SaveHTM button was clicked to output/save all six profiles.
Click on links below next graphic to view each profile.
Six Demographic Profiles
HTML files created for the tracts (profiles for individual tracts and summary for all tracts):
ACS 2010 & Census 2010 integrated items:
Summary/custom profile -- http://proximityone.com/dda/v36065021900s.htm
ACS 2010 Only
General Demographics - DP1 - http://proximityone.com/dda/v360650219001.htm
Social Characteristics - DP2 - http://proximityone.com/dda/v360650219002.htm
Economic Characteristics - DP3 - http://proximityone.com/dda/v360650219003.htm
Housing Characteristics - DP4 - http://proximityone.com/dda/v360650219004.htm
Census 2010 Only
Census 2010 General Demographics - http://proximityone.com/dda/v36065021900c.htm
See additional information about the content and use of these profiles and about census tracts.
