Site Analysis Using DMILab Tools -- small area demographics & pattern analysis
Decision-Making Information
Contact Proximity for information
resources and solutions ...
(888) DMI-SOLN
(888) 364-7656
Site Analysis helps us
understand what the demographics are telling us about a location, or alternative locations,
for an area/market serviced by a store or office.
What are the characteristics of the service area? ... what is the service area? how might the size of the service area change in the future?
... how have the demographics of the service area changed since Census 2000?
... how and where might the demographics change in the next several years?
Effective site analysis plans require maps that depict reference and demographic characteristics, thematic patterns,
of neighborhoods and planning units for areas served by a business establishment.
This section provides a guide to the use of the DMILab Tools
for site analysis.
Examples show how to acquire, integrate and analyze small area (block group)
demographics for business establishments located anywhere in the U.S.
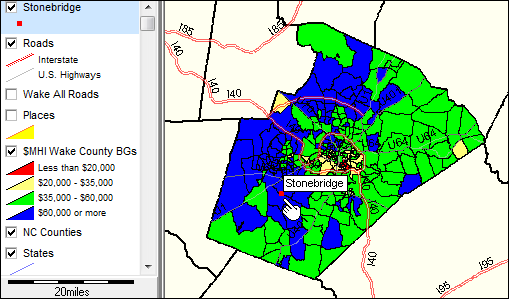
Stonebridge & Wake County, NC $MHI by BG
click for larger view
Study Area Example
Stonebridge Village, located at Kildaire and Ten Ten, Cary, NC 27518, is used to illustrate steps involved.
Substitute your own location of interest and perform similar steps for your area.
The tutorial uses small area demographics for block groups.
This map graphic shows the relationship
of block group geography to other small area geography.
The graphic at the right shows a completed project view. To examine this project and files,
expand this zip file to c:\dmilab
(it must be expanded to this folder)
and open the DMILab project c:\dmilab\stonebridge2.gpr (DMILab installation required; see below).
Additional details on this project and view also provided below.
Using DMILab Tools
DMILab Tool Features
The version of DMILab Tools used here does not include a site area defining tool (such as radius, corridor, etc.).
Nor, does it provide the demographic estimates and projections profile.
These features are included in the CommunityViewer GIS site analysis operations. See
examples and details.
The Decision-Making Information Lab (DMILab) is a set of tools that provide a flexible, dynamic environment --
a virtual DMI laboratory -- to explore new, alternative and innovative ways to evaluate, create and use improved decision-making information.
Using this resource, the remainder of this section will review:
• installation of DMILab tools on your Windows computer
• start-up of DMILab
• use of Find Address tool to show location of property and create point shapefile
• saving this property point shapefile and associated project
• adding state by county shapefile to project and save modified project
(enables viewing of property in context of state/county)
• adding county by block groupshapefile to project and save modified project
(enables viewing of property in context of small area service area geography)
• adding block group demographics and creating thematic/pattern maps
(enables viewing of property in context of small area demographics)
Install DMILab Tools
Review the scope, purpose and capabilities of the DMILab Tools.
Install DMILab Tools on your computer.
DMILab must be installed in the default location for use of this tutorial.
Many DMILab steps illustrated here require Internet. However, most analytical operations do not require Internet.
DMILab Start-up
Once installed, start DMILab Tools on your computer using the DMILab desktop icon.
The first operational step is to locate the property of interest and show the property location in the map window.
This section does not review the basics of DMILab operation.
See the DMILab Tools main page for more information.
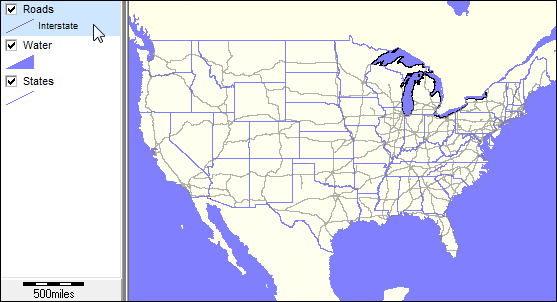
Open the U.S. National Scope Project
With DMILab running, use File>Open (main menu) and open the project c:\dmilab\us1.gpr.
(this assumes that DMILab has been installed in the default install folder). The view appears as shown here:
In the legend panel, uncheck the roads layer.
Click Options>Set Canvas Blue.
Select File>Save Project As. In the dialog, save the project as "c:\dmilab\stonebridge1.gpr" (no quotes).
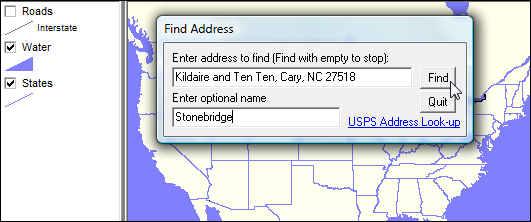
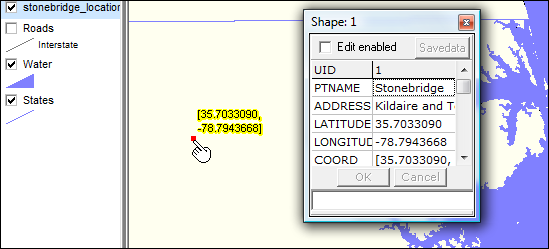
Use the Find Address tool to create a point shapefile for the property location and show the location on the map.
Click Tools>Find Address (main menu)".
A form appears that shows a start-up address.
Overwrite that address with "Kildaire and Ten Ten, Cary, NC 27518" -- no quotes.
... Typically you would use the full address.
Key in the name "Stonebridge", no quotes, in lower edit box and click the Find button.
You are prompted for another address. Click Quit button for this application.
The following view shows how you would complete the Find Address form.
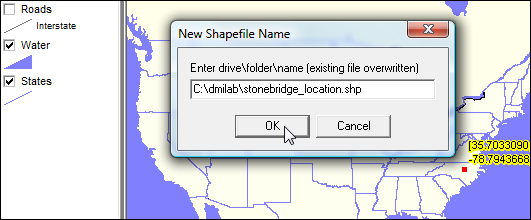
You are prompted for a file (shapefile) folder and name. Use "c:\dmilab\stonebridge_location.shp). Click OK.
The following graphic shows the location (red marker) how you would enter the shapefile name.
The shapefile name appears in the left control panel.
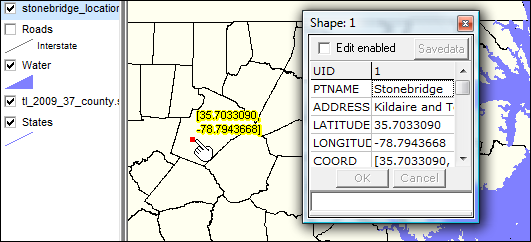
Use the leftmost zoom tool (toolbar) and zoom to the Stonebridge area.
The following graphic shows how how the view should now appear.
Re-save your project ... click File>Save.
2. Add the North Carolina by County Shapefile to the Project
• Click File>GeoGateway
• In the GeoGateway form, click State radiobutton in section 2.
• In 3b, select Counties current and click North Carolina.
• Click Get Data button.
• Close the GeoGateway form.
• On the toolbar, click the + Add Layer button (immediately left of edit box, 10th from left).
• In the open file dialog, open the file c:\dmilab\tl_2009_37_county.shp.
• The view now appears as shown below.
- this view illustrates use of the identify tool to click on the property location (red marker).
- a mini profile showing attributes of this marker appears in context of county.
Re-save your project ... click File>Save.
We now have a basic project that shows the property location in context of the state by county.
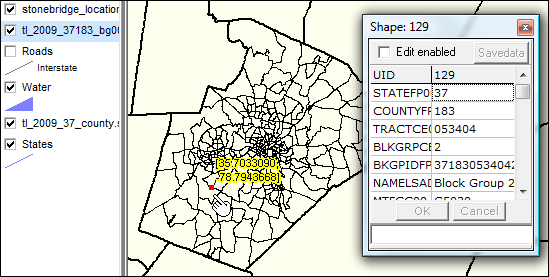
3. Add the Wake County, NC Block Group Shapefile to the Project
• Click File>GeoGateway
... we could select the whole state, but use one county here to illustrate.
• In 3b state list, click North Carolina.
• In 3c dropdown, select Block Groups (2000).
• In 3c county list, select 37183 Wake County.
• Click Get Data button.
• Close the GeoGateway form.
• On the toolbar, click the + Add Layer button (immediately left of edit box, 10th from left).
• In the open file dialog, open the file c:\dmilab\tl_2009_37183_bg00.shp.
• The view now appears similar the graphic below appears.
- this view illustrates use of the identify tool to click on the block group near the property.
- a mini profile showing attributes of this block group appears.
Re-save your project ... click File>Save.
4. Download & Integrate Block Group (BG) Demographics into Your BG Shapefile & Project
- county by block group shapefile has been added, but contains no demographics
- a two step process is involved 1) download the demographic data and 2) integrate the data into the shapefile.
Step 1 - get the demographics
• start FactFinder
• select Datasets>Decennial Census (left panel)
• select radiobutton Census 2000 Summary File 3 (SF 3) and then click Detailed Tables (right panel)
• click geo-within-geo tab
• select Block Groups in "Show me all" menu
• select County in "Within" menu
• select North Carolina in "Select a state" menu
• select Wake in "Select a county" menu
• click "All block groups" and then the Add button then click Next button
• click table P8 and then Add button
• click table P53 and then Add button
... this to illustrate the analyses are not restricted to just a few items ... pick your own.
• click Show Result button
• upon table display, click Download from upper menu bar
• in download menu, click Microsoft Excel (xls) radiobutton then click OK button
• extract the one file "dt_dec_2000_sf3_u_data1.xls" and save to c:\dmilab\wake
• done with FactFinder; close browser.
• in DMILab, if map project open, use File>Close.
Step 2 - integrate the demographics into the shapefile
• in DMILab, click Tools>Import-Export-Merge.
• on Import-Export-Merge, click Select button at top right of XLS panel
• select the file just extracted -- c:\dmilab\wake\dt_dec_2000_sf3_u_data1.xls
• click Open button at top center of XLS panel ... the grid populates
• click Export button above XLS grid ... DB1 (middle grid) populates
• click Select DB1 fields ... then click OK (we will take all fields)
• on DB2 panel, click Select button and select the Wake County shapefile dbf ... C:\dmilab\tl_2009_37183_bg00.dbf
• click Select DB2 fields ... then click OK (we will take all fields)
• for the DB2 Merge Key use the key field name "BKGPIDFP00" -- without quotes.
• click Merge DB1 & DB2 ... the merge completes.
• close the Import-Export-Merge form.
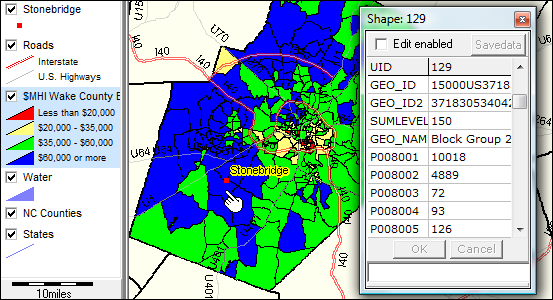
Median Household Income for Wake County by Block Group
- in this section, a thematic map is created by by setting intervals for MHI in the BG layer.
• - the block group shapefile now contains demographic data. Thematic maps may be made for pattern analysis.
• - pattern views will provide insights into the demographic patterns by block group for the service area.
- $MHI is used as it is an easy example; wide ranging other data may be selected.
- see the CommunityViewer GIS user guide and layer editor in particular.
• select File>Open Project in DMILab main menu bar ... open the file c:\dmilab\stonebridge1.gpr
• in the legend panel at left, dbl-click the layer tl_2009_37183_bg00
• the Layer Editor appears.
... nit-picky steps must be followed ... select Solid as the Pattern option.
• click the Section tab. In the "Render if ..." key in "P053001 < 20000" (no quotes)
• click Area tab and select the color as red
• click checkbox "Include in Legend"
-- repeat the above three steps 3 additional times by clicking the + to add a new section.
• in the "Render if ..." key in "P053001 >= 20000 and p053001< 35000" (no quotes)
• click Area tab and select the color as yellow
• in the "Render if ..." key in "P053001 >= 35000 and p053001< 60000" (no quotes)
• click Area tab and select the color as green
• in the "Render if ..." key in "P053001 >= 60000" (no quotes)
• click Area tab and select the color as blue
-- click OK closing the layer editor.
A view similar to the one shown in the following graphic can now be made.
Compared to the view that you have developed, the above view has been augmented with the addition of roads layer,
Interstate, U.S. by state, and the order of the layers has been shifted in the legend panel.
This view does not show the detailed roads (unclicked) in the map view panel but Interstate is shown.
The above view shows the block group geocode as a label for yellow-colored block groups.
The identify tool is used to click on a block group that results in the display of a mini profile showing demographics
for that block group.
About the Stonebridge2 Project
The graphic at the top of this page (and below) shows the start-up view of the
DMILab project c:\dmilab\stonebridge2.gpr.
The project is provided as a somewhat completed project that you
might find useful after completing the tutorial.
The stonebridge2.gpr project removes the all U.S. water features and the all U.S. roads features.
Using the File>Export Layer, a new roads layer was created from the national file focused on Wake County, NC area
and added to the stonebridge2 project. The SQL query "(stfips = '37' and ctfips='183') or sign1 like 'I%'" was applied
to create the new shapefile "nhpnline37183.shp" that was added to the stonebridge2 project.
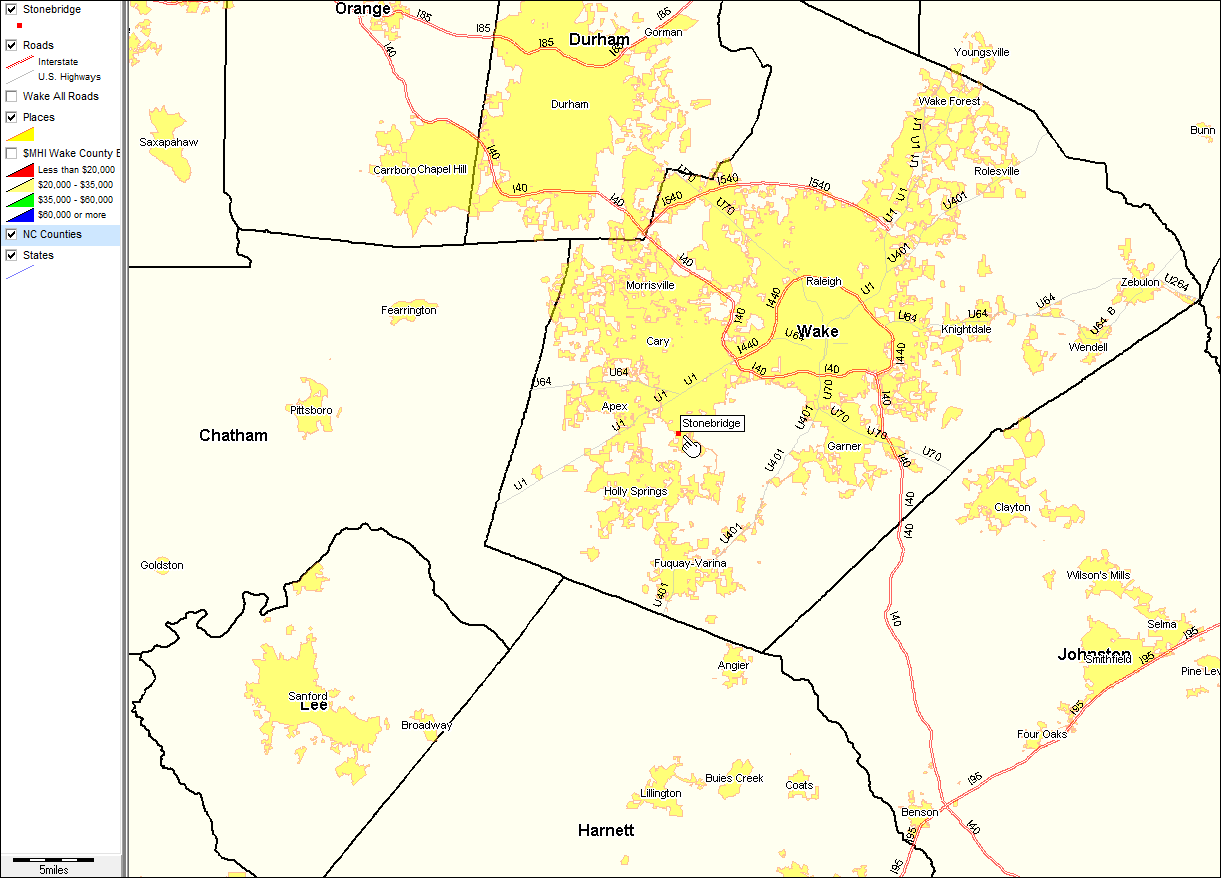
Continue to Expand the Stonebridge2 Project
Use File>GeoGateway to add other layers to the project. The next view shows North Carolina places (yellow fill pattern)
added to the view. Click graphic for larger view then press F11 key.
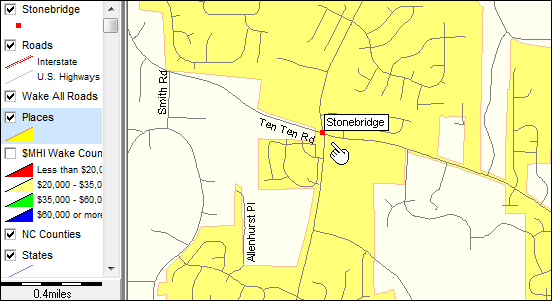
Alternatives Views made Easy; Re-usable Base Files
Stonebridge location in context of Cary, NC city with street detail.
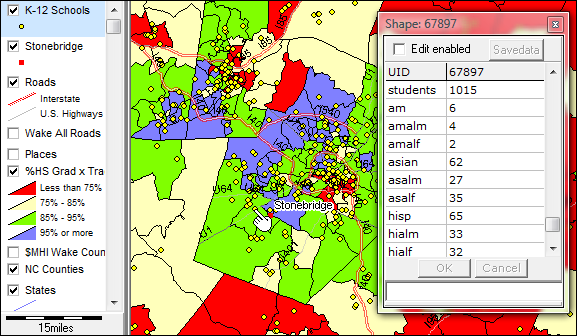
Adding K-12 Schools; Statewide Census Tract Thematic Pattern: %High School Graduate
This view shows the Stonebridge location and same general contextual view with two layers added.
- K-12 schools -- yellow markers; school profile (students by race/ethnicity) (by pointer)
- percent high school graduate by census tract, statewide
Supplementary Views
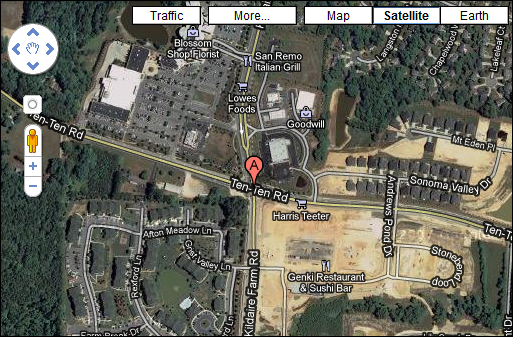
Stonebridge location via Google Map; use same address to locate.
Additional Information
Proximity develops geodemographic-economic data and analytical tools and helps organizations knit together and use diverse data in a decision-making and analytical framework. We develop custom demographic/economic estimates and projections, develop geographic and geocoded address files, and assist with impact and geospatial analyses.
Wide-ranging organizations use our resources (software, data, methodologies) to analyze their own data integrated with other data.