Truman Reservoir Area

Contents
This section illustrates use of census block level geography on a statewide basis as well as zoom-in to intersection level. The CommunityViewer site analysis tool is used to examine demographic characteristics of a study area defined as a set of census blocks around a point of interest. In addition, the zoom-in study area selected is focused on the Corps of Engineers Truman Dam and Reservoir. This section illustrates how census water blocks may be used to identify water bodies.
View developed using the Proximity C2KBLK database -- http://proximityone.com/c2kblk.htm. There are more than 241,000 census blocks covering Missouri wall-to-wall. See pointer in this view; next view shows zoom-in to that area.
|
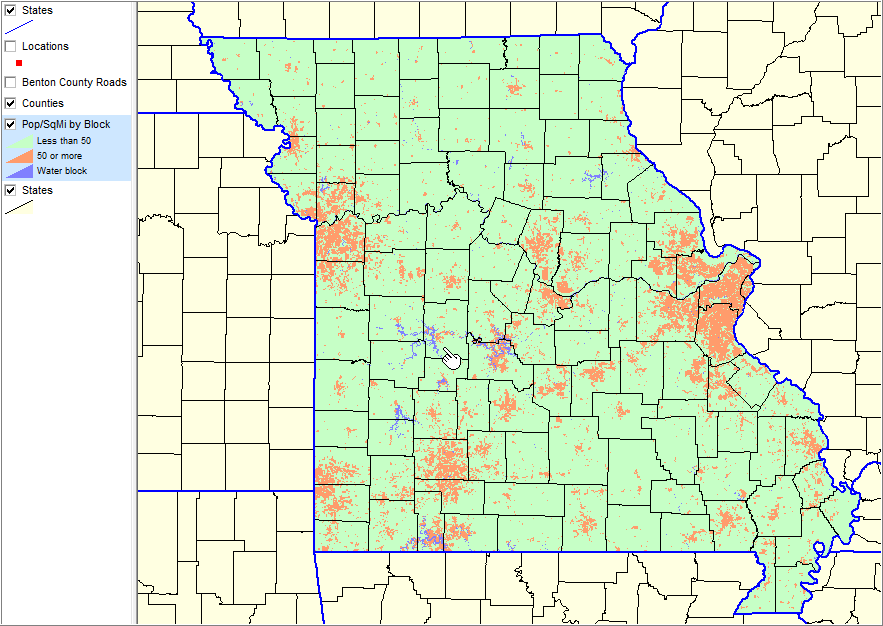
Using the CommunityViewer Layer Editor, the above view is developed by using an SQL-like query applied to the layer/shapefile. This setting is shown in the following Layer Editor view (invoked by dbl-clicking the layer name in the legend panel). This can be saved or used dynamically. P001001 is total population, arealand is land area in square meters, the constant adjusts the computed value to square miles. Any of the items in the block database may be accessed/manipulated in this manner. Area colors are set using the Area tab. Given the number of blocks in this view perspective, the block boundary width has been intentionally set to zero, so contiguous same color blocks appear to “run together.”
|
Zoom-in view to pointer location shown in previous map. Water blocks show location or Truman Reservoir. Benton County (29015) roads shown for perspective. Selected locations of interest shown by red markers. Next map shows site analysis of area near location shown by pointer.
|

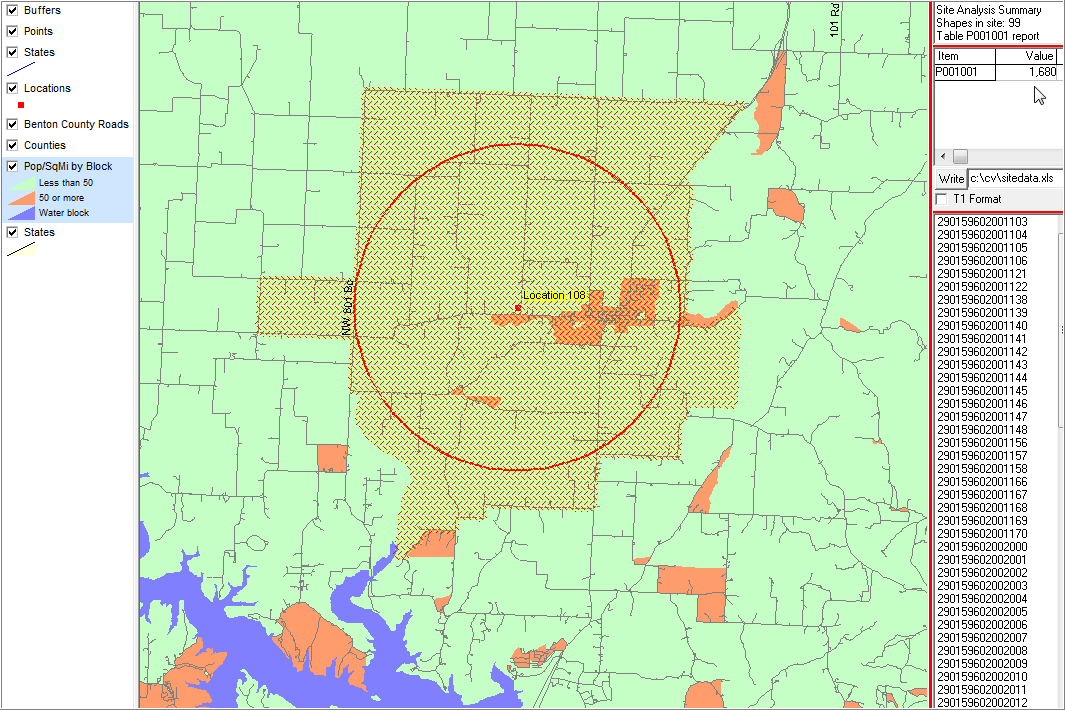
Further zoom-in to location shown by pointer in previous map. Using CV site analysis tool, a 3-mile radius circle is selected. Attributes of census blocks in this study area are selected/aggregated. Upper right section shows the 99 census blocks intersecting the circle had a Census 2000 population of 1,680. Geocodes for census blocks comprising this study area are listed in the lower right; that list can be output to XLS. Selected blocks can also be output to a new shapefile.
|
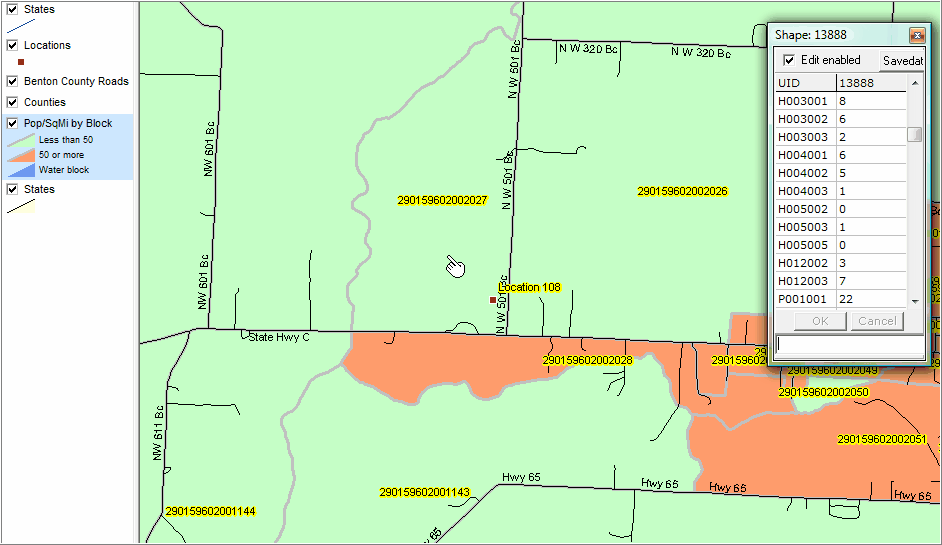
Further zoom-in to intersection level. Roads layer clicked on CV Identify tool used to show profile of attributes of selected census block (gray boundaries) - see pointer. Field names to left (in profile box) are listed at Proximity C2KBLK database description -- http://proximityone.com/c2kblk.htm. Subject matter values listed to right; p001001, total population, is 22.
|