Northern Virginia

Contents
Selected CommunityViewer project/application views in Virginia.
Click toggle in Table of Contents at left to view state/sub-state applications.
Integrating Census 2010 TIGER Shapefiles, ACS 2009 5-year demographics, Census 2010 and related data.
See related interactive ranking tables:
| • | Virginia school district demographics: http://proximityone.com/sd_va.htm. |
| • | Virginia census tract demographics: http://proximityone.com/ustr0509_va.htm. |
| • | Census 2010 demographics: http://proximityone.com/cen2010_pl94171.htm |
(all US geography: state, congressional district, county, school district, city/place, metro)
Selected Northern Virginia Area Views
More about metros and Situation & Outlook
| • | Metropolitan Area Guide: http://proximityone.com/metros/guide |
| • | MetroView: demographic-economic profiles & patterns -- http://proximityone.com/metroview.htm |
National to Intersection Level Multicultural Analysis Using Census 2010+
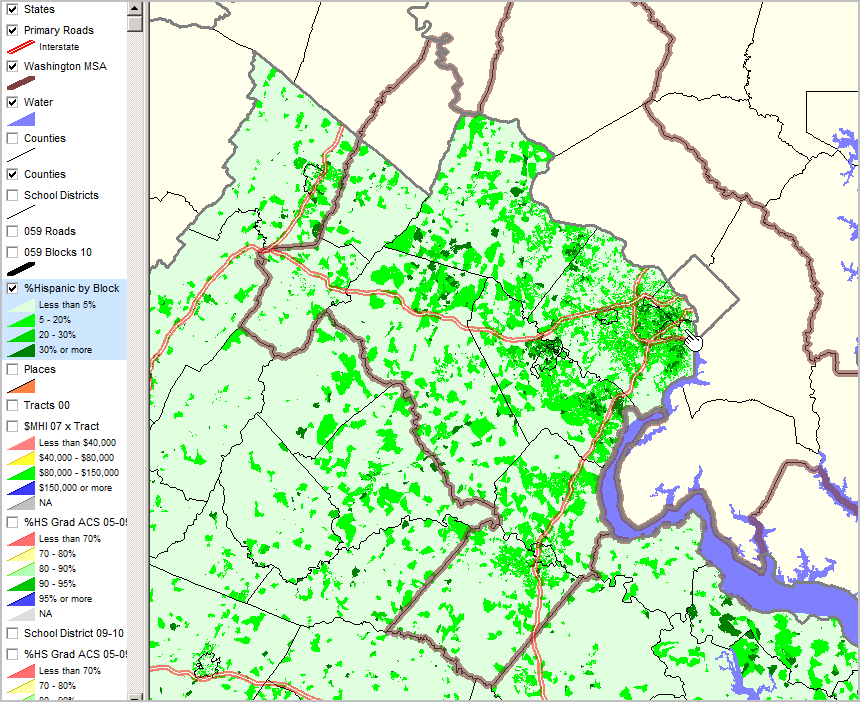
Northern Virginia by Census Block; Washington, DC Metro shown with bold brown boundary Percent Hispanic Population data from Census 2010 P.L. 94-171. Hispanic population used to illustrate, select from 70+ multicultural race/ethnic combinations. See http://proximityone.com/cen2010_pl94171.htm for additional information and related ranking table. Pointer in this map shows area for drill-down views and site analysis in following graphics. |
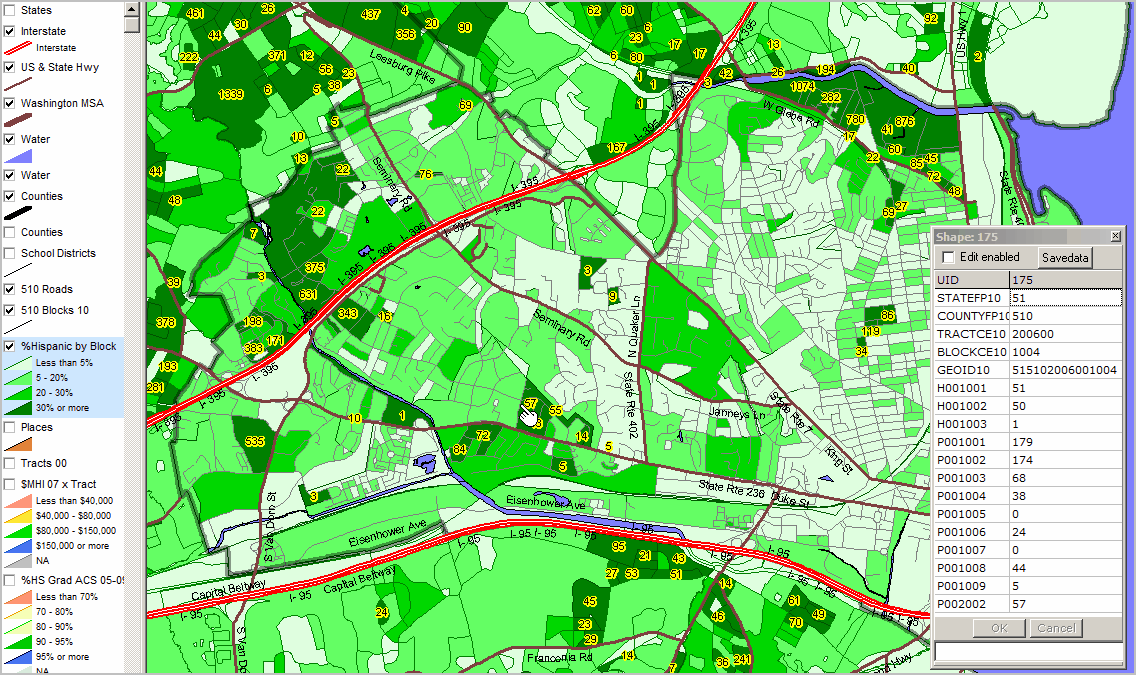
Alexandria shown with bold black boundary. Percent Hispanic population by census block shown as thematic pattern (see intervals in legend; highlighted layer). Blocks labeled with total Hispanic population for layer interval 30% or more. CV Identify Tool used to display partial profile of attributes for selected block (see pointer). Profile/table shows values for P.L. 94-171 demographic items. See more about P* item names/descriptions. Profile shows item P002002, total Hispanic population, in this block (51-510-200600-1004) is 57 (see also as label on block at pointer)
|
Illustrating a CommunityViewer GIS site analysis for selected census blocks ... -- using Census 2010 census block demographics for multicultural analysis
The next view is a zoom-in to pointer/hand shown in lower center of previous view. Alexandria city, VA is shown with bold black boundary. Percent Hispanic population by census block shown as thematic pattern (see intervals in legend; highlighted layer). Blocks labeled with total Hispanic population for layer interval 30% or more. CV Identify Tool used to display partial profile of attributes for selected block (see pointer). Profile/table shows values for P.L. 94-171 demographic items. See more about P* item names/descriptions.
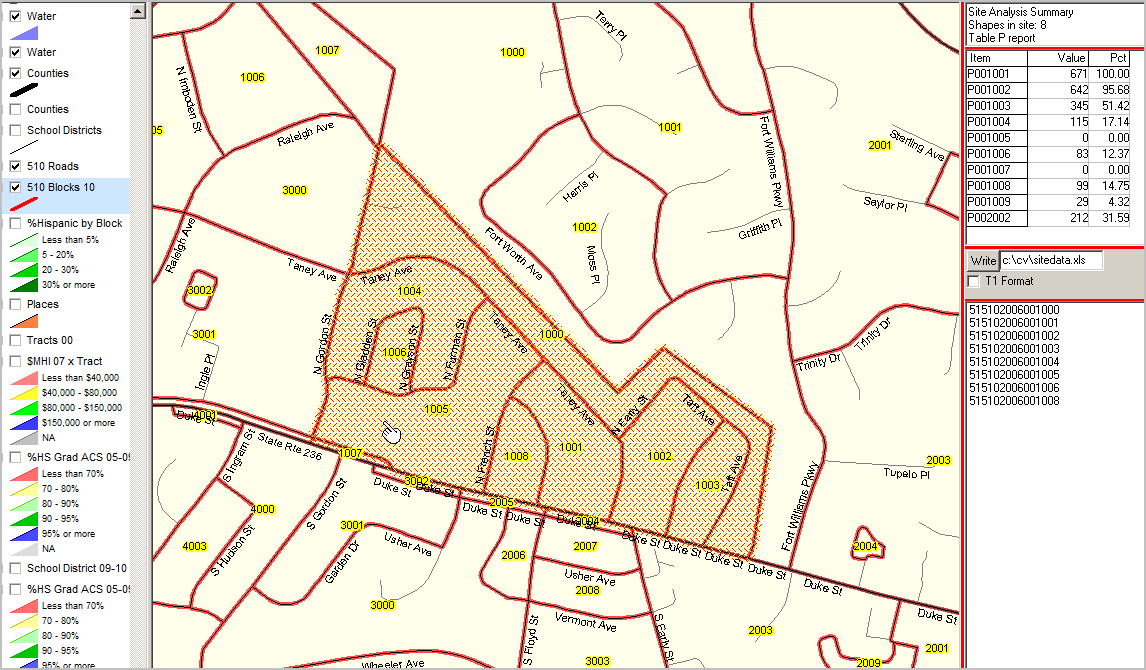
A CV site analysis for 8 "cherry-picked" census blocks is shown in view below (hatched blocks have been selected). Census blocks shown with red bold boundary and yellow labels showing census block codes. The view/analysis may be immediately changed by clicking/dragging mouse.
The aggregated values for the 8 blocks for selected PL 94-171 items are shown in upper right table within the graphic below. The total population is 671; the Hispanic population is 212 (31.59%) -- all dynamically computed. List of census block geocodes is shown in the lower right listbox in the graphic below. The geocode list may be optionally saved as a spreadsheet file. Selected census blocks are auto-saved as a shapefile for optional future use.
|
Patterns of Educational Attainment & Economic Prosperity by School District & Census Tract
Educational Attainment by School District Percent high school graduate (population 25 years and over) by school district. Data based on 2009 American Community Survey (http://proximityone.com/acs.htm) 5-year estimates, centric to mid-2007.
Washington, DC Metro bold brown boundary
|
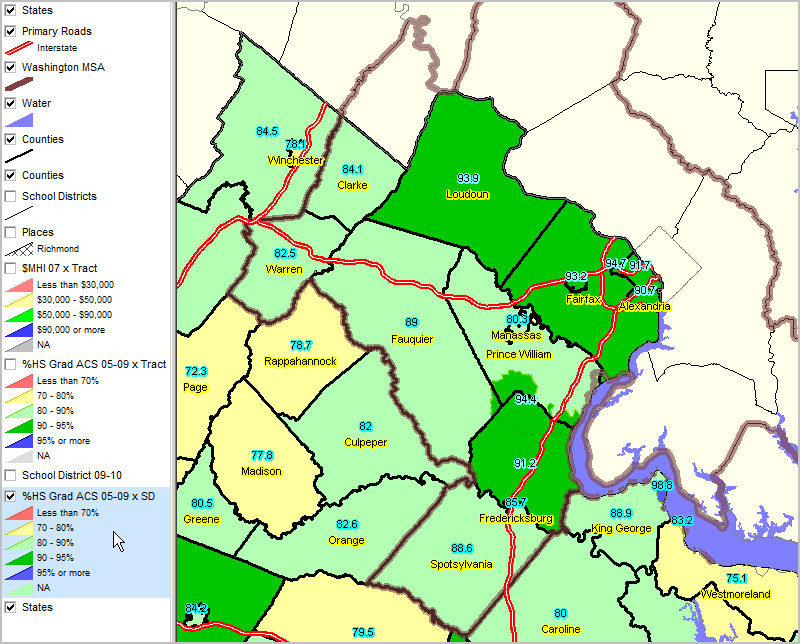
Educational Attainment by Census Tract Percent high school graduate (population 25 years and over) by census tract. Data based on 2009 American Community Survey (http://proximityone.com/acs.htm) 5-year estimates, centric to mid-2007.
Washington, DC Metro bold brown boundary
|

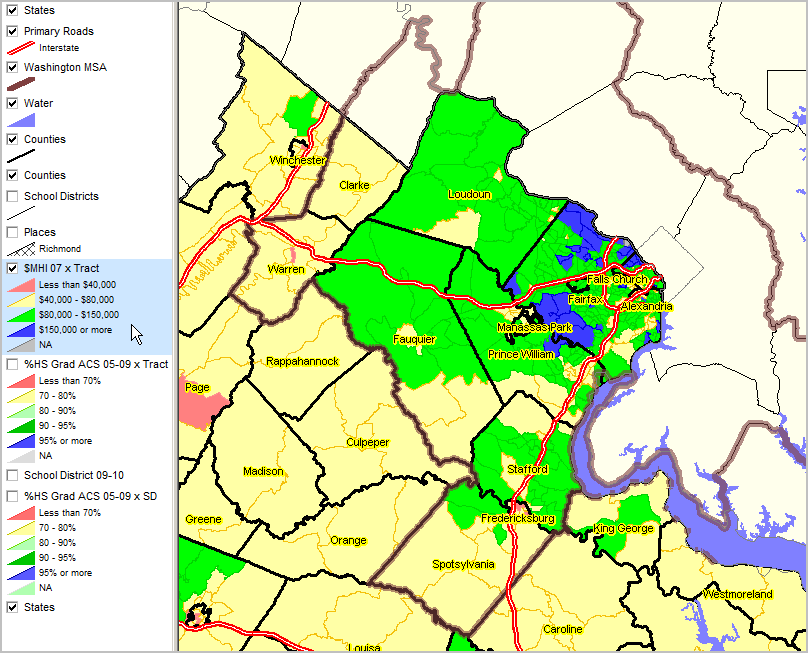
Median Household Income ACS 2005-09 (mid-2007) ... using ACS census tract estimates released December 2010 (http://proximityone.com/acs.htm).
Washington, DC Metro bold brown boundary
|
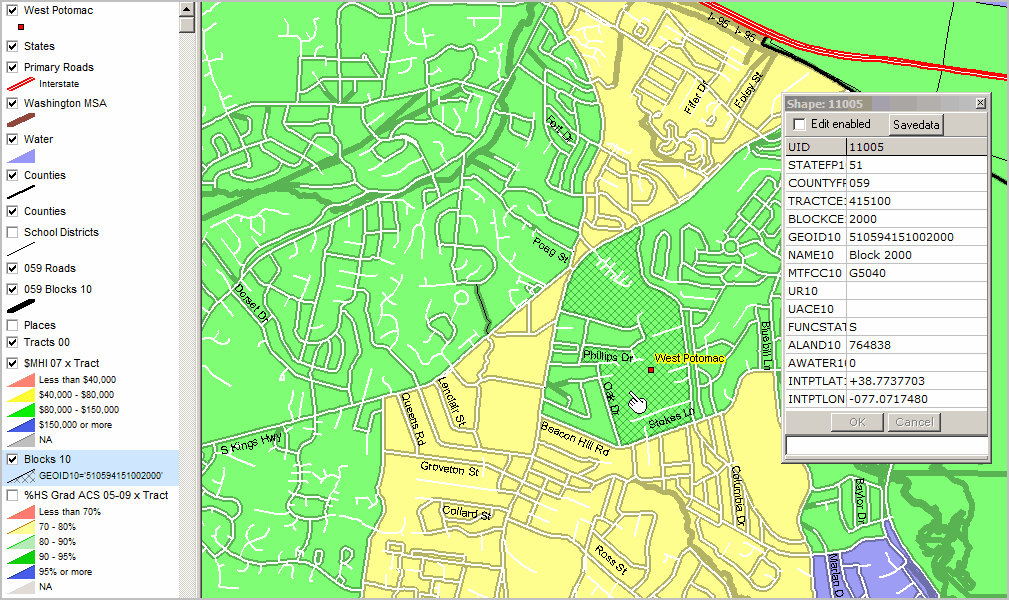
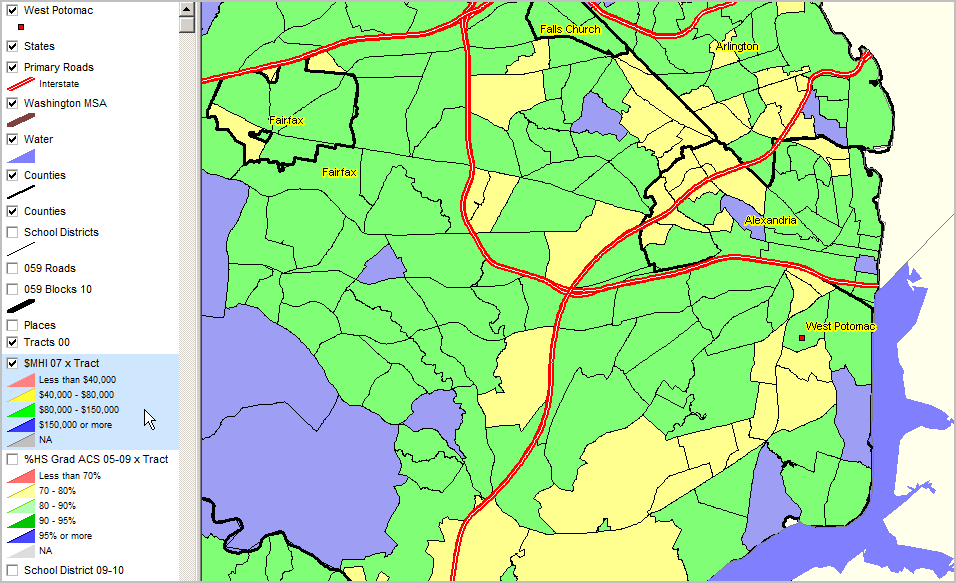
Illustrative school location shown by red marker. Next view shows further zoom-in to school location & neighborhood census blocls.
|
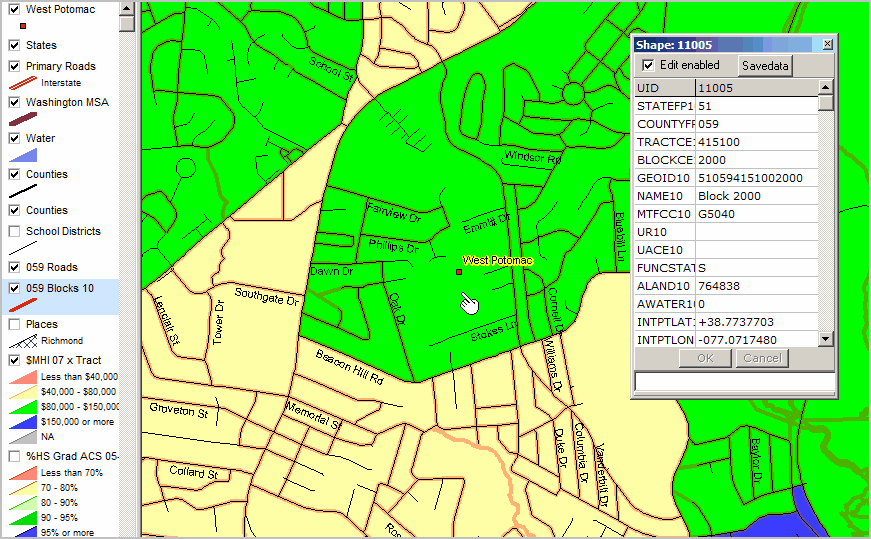
Area shown similar to previous view, streets as white lines; blocks bold gray with transparency. Block "2000" shown with cross-hatching (see pointer) and with corresponding profile.
|