Arizona School District Finances

Contents
Using CVXE GIS to examine school district revenue and expenditure patterns. View/analyze school district financial patterns in context of wide ranging other geography.
School district main section: http://proximityone.com/sddmi.htm
Analyzing the school district community patterns and characteristics: http://proximityone.com/sdcommunity.htm
School district finances main section: http://proximityone.com/sdfa11.htm
- CV XE S&O Financial Analysis
113th Congressional Districts -- http://proximityone.com/cd113.htm
- Arizona neighborhood patterns of economic prosperity by Congressional District -- http://proximityone.com/cdgallery/guide/az.htm
Arizona 2011 Federal Revenue as Percent of Total Revenue by School District
- Percent interval/color patterns shown in legend at left of map -- pattern layer set to 70% transparency
- 113th Congressional Districts -- black boundaries with yellow labels
See selected state and other views by clicking links in left section.
Create custom views or analyses -- contact ProximityOne 888.364.7656
See related Phoenix area in view below state map.
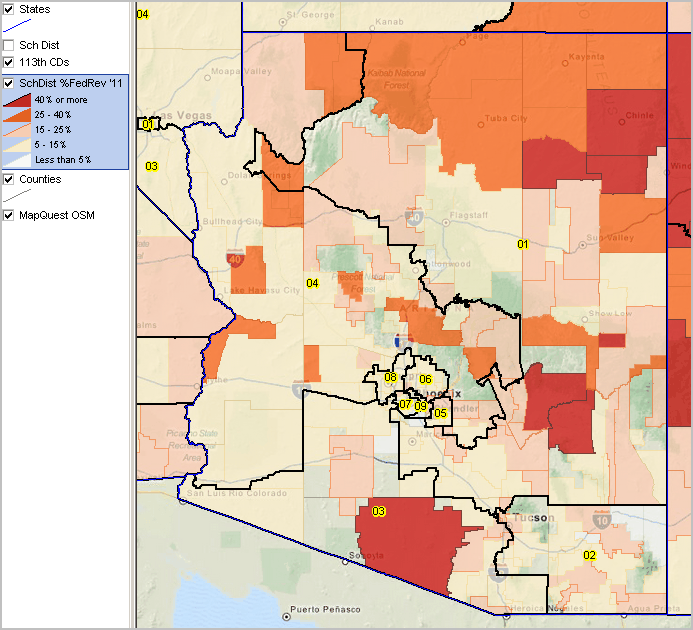
Arizona 2011 Federal Revenue as Percent of Total Revenue by School District
- Phoenix area zoom-in; school district Federal code white label; school districts shown with thin gray boundary
- Percent interval/color patterns shown in legend at left of map -- pattern layer set to no transparency
- 113th Congressional Districts -- black boundaries with yellow labels

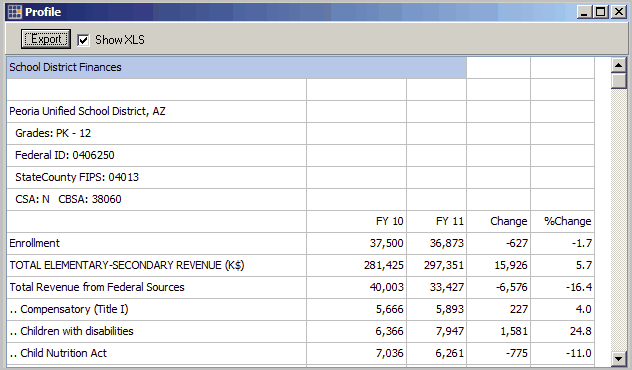
Peoria Unified School District Financial Profile
Partial graphic shown below. Click to view full profile: http://proximityone.com/sdfa/az_peoria.xls