Cypress-Fairbanks ISD

Contents
Selected CV XE GIS project/application views in Texas.
Click toggle in Table of Contents at left to view sub-state applications.
Integrating shapefiles, ACS demographics, Census 2010 demographics, estimates & projections and related data.
See related interactive ranking tables:
| • | Texas school district demographics: http://proximityone.com/tx_sdc.htm. |
| • | Texas census tract demographics: http://proximityone.com/tracts11dp1.htm. |
| • | Census 2010 demographics: http://proximityone.com/s&o_comparative_profiles.htm |
(all US geography: state, congressional district, county, school district, city/place, metro)
Join the conversation .. ProximityOne on Twitter -- https://twitter.com/ProximityOne
The toggle graphic -- ![]() -- indicates an expanding section. Click the toggle or toggle line to view/close expanding sections.
-- indicates an expanding section. Click the toggle or toggle line to view/close expanding sections.
Compare Waco ISD - Pearland ISD - Texas ACS 2009 3-year estimates -- open this spreadsheet
-- 4 sheet spreadsheet file: demographic, social, economic, housing profiles
The GIS project fileset used to develop the views shown below is available for your use. Add your own data; create alternative views. We can also provide custom map views or analyses to meet your needs. Contact us for details (888-364-7656).
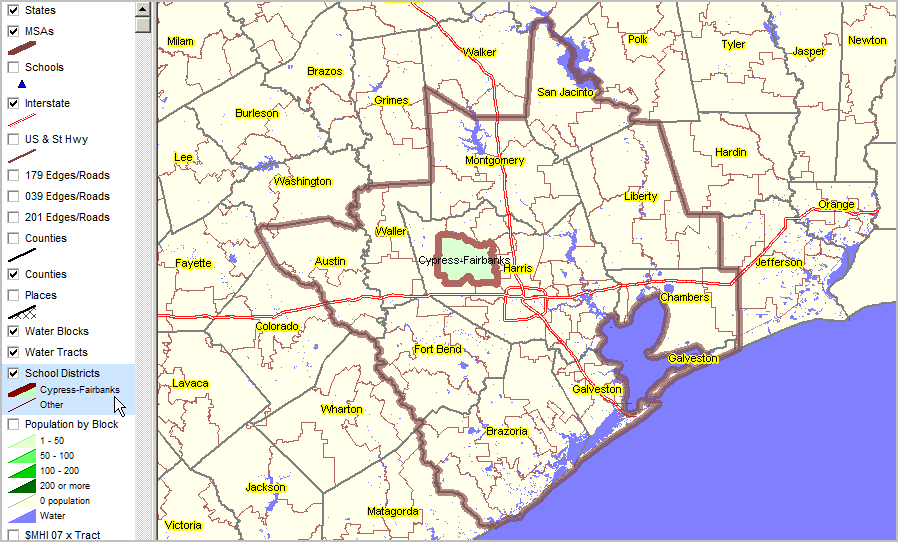
Cypress-Fairbanks ISD bold brown boundary green fill pattern in context of Houston MSA (bold brown semi-transparent boundary)
|
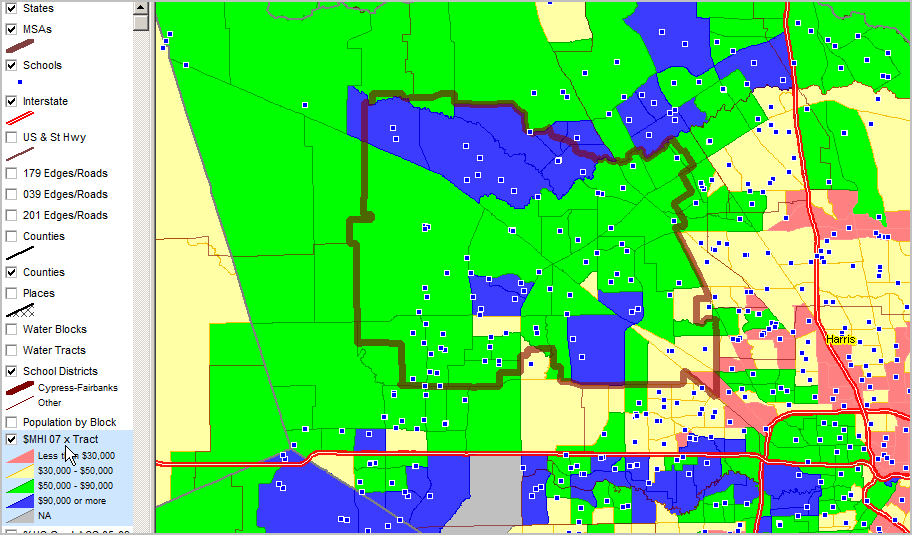
Median Household Income ACS 2005-09 (mid-2007) ... using ACS census tract estimates released December 2010 (http://proximityone.com/acs.htm). See highlighted (blue) layer in legend (left of map) for color/data value interval definitions. K-12 Schools blue markers.
|
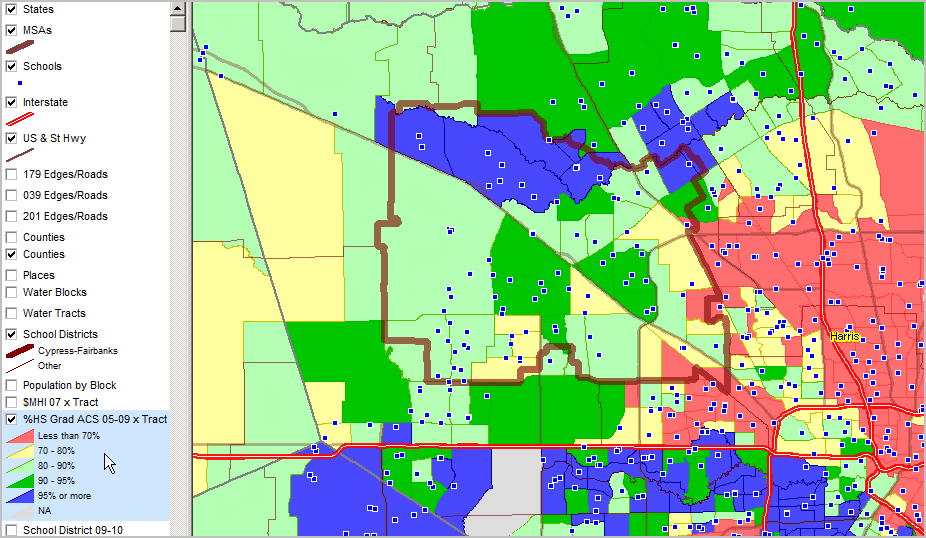
Percent high school graduate (population 25 years and over) by school district. Data based on 2009 American Community Survey (http://proximityone.com/acs.htm) 5-year estimates, centric to mid-2007. See highlighted (blue) layer in legend (left of map) for color/data value interval definitions. K-12 Schools blue markers.
|
See highlighted (blue) layer in legend (left of map) for color/data value interval definitions. More about these data: http://proximityone.com/cen2010_blocks.htm.
|
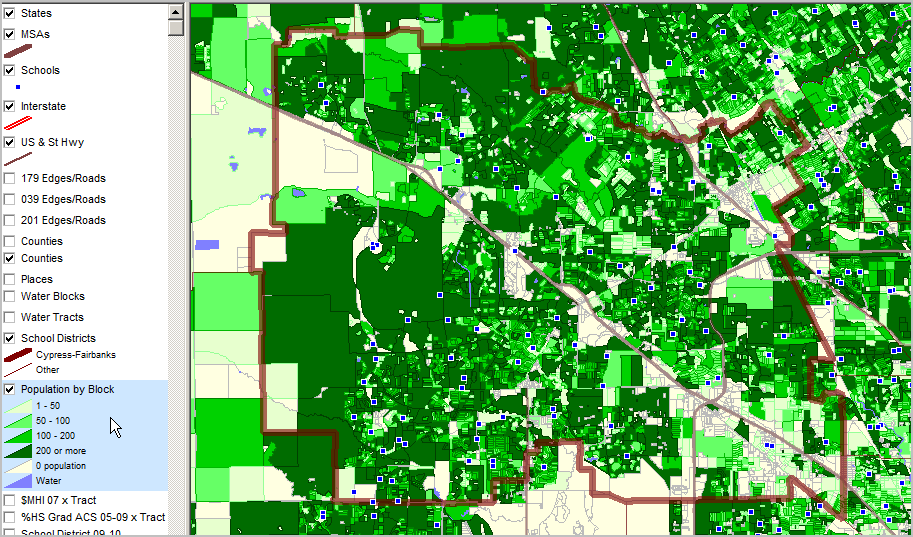
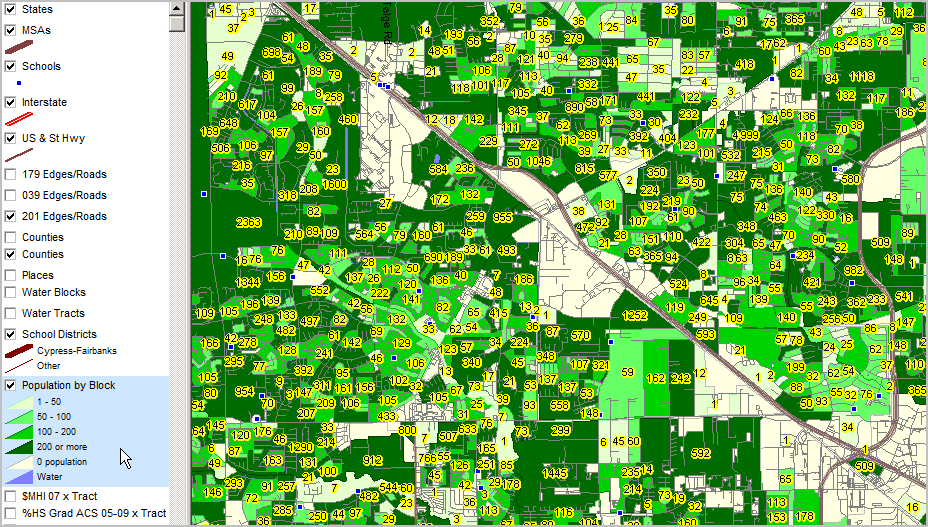
View similar to above showing total population by block as label. Intersection-to-intersection street detail and K-12 schools shown.
|
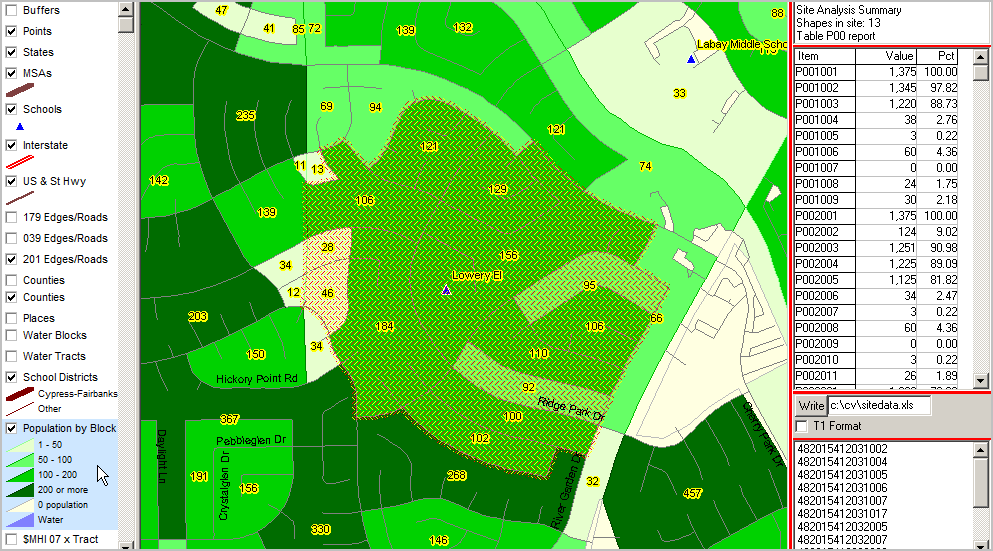
Further zoom-in ... CV Site Analysis operation applied to census block layer; "cherry-picked" blocks in school vicinity. In the graphic below, table in upper right shows 13 blocks (cross-hatched) in this study area.
Aggregate demographics for selected blocks are shown in the mini table below that count: 1,375 total population in this set of blocks (p001001); 1,220 "White population of one race" (p001003) in this set of blocks. 124 Hispanic (p002002) and 1,251 non-Hispanic (p002003) Item names shown in left column of profile defined at http://proximityone.com/cen2010_blocks.htm.
List of geocodes for blocks included shown in lower right mini table. By clicking "Write" button, the summary data are written to specified spreadsheet file.
|