|
|
|
Albany County, New York Map Project This section provides information on how to download and use the Albany County, NY mapping application project. How to Acquire the Map Project. The Albany County, NY map project as a zip file is 3.5MB and expands to 9MB. The map file project may be accessed electronically and loaded on your computer. Contact Proximity for access information. Files in the Map Project. The files used in the map project reviewed here are for Albany County, NY. Albany County is represented as FIPS (Federal Information Processing Standards) code 001 in New York which is FIPS state code 36. The shorthand geocode notation for Albany County, NY is 36001. This shorthand coding enables us to use the same set of state and county codes to refer to San Francisco County (075) in California (06) as 06075. The files on the distribution CD-ROM or in the zip file are "shape file sets" and project files. For convenience of reference, it is assumed that users download the zip file and expand it into a folder named c:\nymaps. The shape files referenced in the project file as distributed (all references are for Census 2000 except as noted) are: • m36001u.* -- unified school districts • m36001c.* -- county perimeter • m36001p.* -- places (cities) • m36001t.* -- census tracts • m36001g.* -- census block groups • m36001b.* -- census blocks • d36001.* -- school districts (points) (based on US Department of Education annual data) • s36001a.* -- schools (points) (based on US Department of Education annual data) • m36001r.* -- streets • majroads.* -- major streets (TIGER Census Feature Class Code A11) street segments • m36001l.* -- landmark polygon areas • m36001pt.* -- landmark points where * refers to the [typically] three files comprising the shape file set: .shx, .shp, and .dbf. Software Options. The map file projects have been set up for use with either the ESRI freeware ArcExplorer (this insures it will cost you nothing to view the mapping applications) and the ESRI feeware ArcView software. Other software options will be described in subsequent versions of this web page. Proximity has built two "project files" that are contained in the zip file. Project files are used by the software to organize access to the set of files used in the mapping application. One project file is for use with ArcExplorer and the other project file is for use with ArcView: C36001.AEP -- this project is for use with the freeware ESRI ArcExplorer C36001.APR -- this project is for use with the feeware ESRI ArcView software Which software to use? If you have the ArcView software, it is unlikely that you would want to use the ArcExplorer project. If you do not have the ArcView software, you can download the ArcExplorer freeware and immediately make use of the c36001.aep project and related files. This section is not a training session on the use of either of these software resources. Refer to separate document or instruction to learn the details of using the software. To download the ArcExplorer software, connect to the ArcExplorer web site operated by ESRI, Inc. Starting the Application (Project). With the software installed, and the files existing in the c:\nymaps folder, you are ready to start. ArcExplorer. Assume that you are using ArcExplorer. Start ArcExplorer as a regular Windows operation. Use File|Open|Project and open the project named C36001.AEP. the screen will then appears as follows: 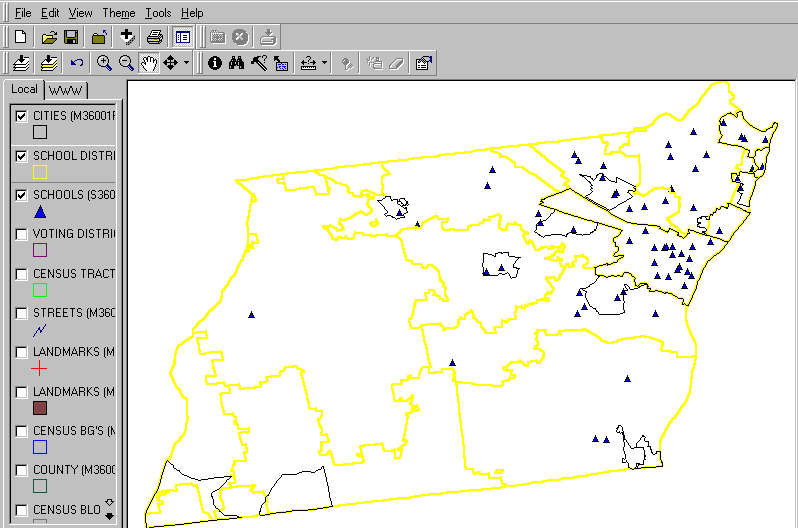 This screen shows three "layers" (map files) "turned on" -- Albany County unified school districts (yellow), places/cities (black), and schools. The other layers, shown in the legend box at the left, are not "turned on." More information is presented on orienteering under the ArcView discussion. This paragraph is the extent of the discussion in the present version of this web page regarding the use of ArcExplorer. We have set up the projects so that the themes appear almost indentical between ArcExplorer and ArcView. So, following the description of ArcView applications should suffice for ArcExplorer also -- with one important exception. There are many applications that are not supported by ArcExplorer. ArcView. Assume that you are using ArcView. Start ArcView as a regular Windows operation. Use File|Open|Project and open the project named C36001.APR. the screen will then appears as follows: 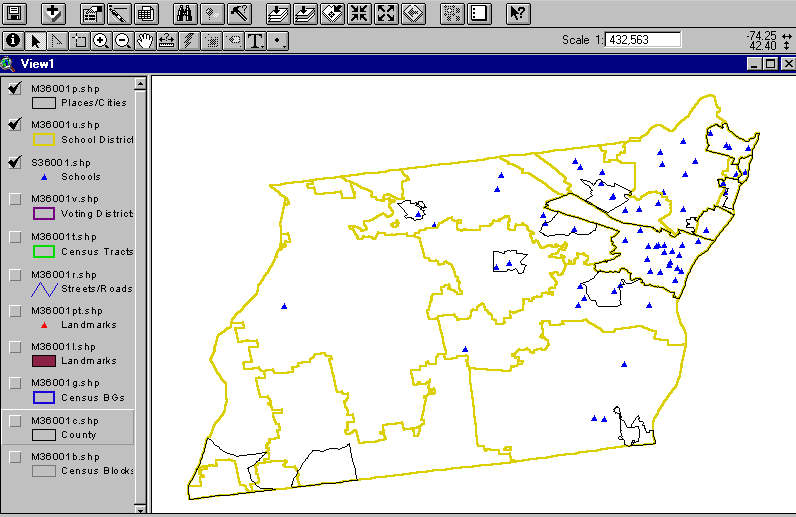 This screen above shows the almost identical set of displays as shown using ArcExplorer (previous screen display). Census 2000 Tracts. View Census 2000 tracts by turning on the Census Tracts layer. The display would appear as follows: 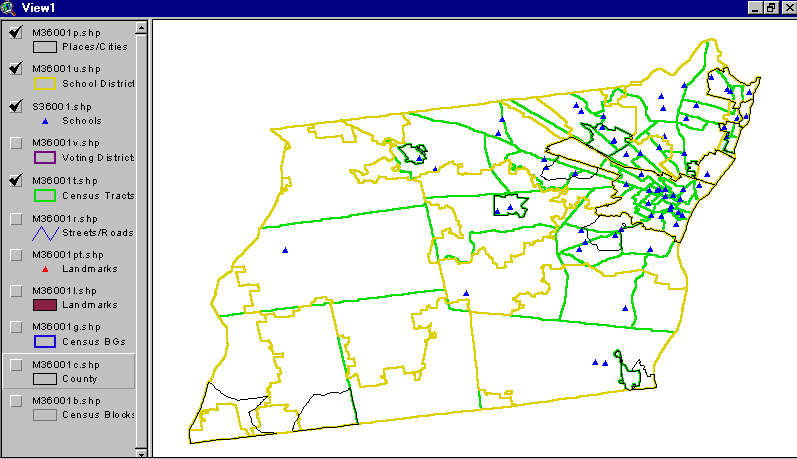 All Roads/Streets View all roads and streets, as conveyed by the Census 2000 TIGER files, by clicking on the roads theme. The display would appear as follows: 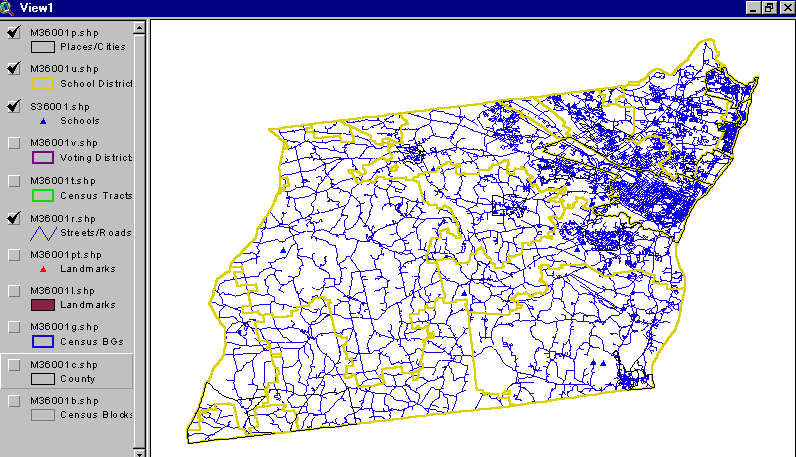
Thematic Maps; Pattern Analysis. Starting with the original project settings, click the box by the Places/Cities layer in the legend at the left to turn that view off. Click the layer legend panel for M36001u.shp. An almost invisible box appears indicating that this layer is the active layer. Double-click the yellow box and the legend editor panel appears. Click on Legend Type and select Graduated Color. Choose Classification Field and select std_total (total students). The intervals showing the distribution of the number of students by district appears. Click Apply. The thematic patterns appear on the map with a view as shown below. 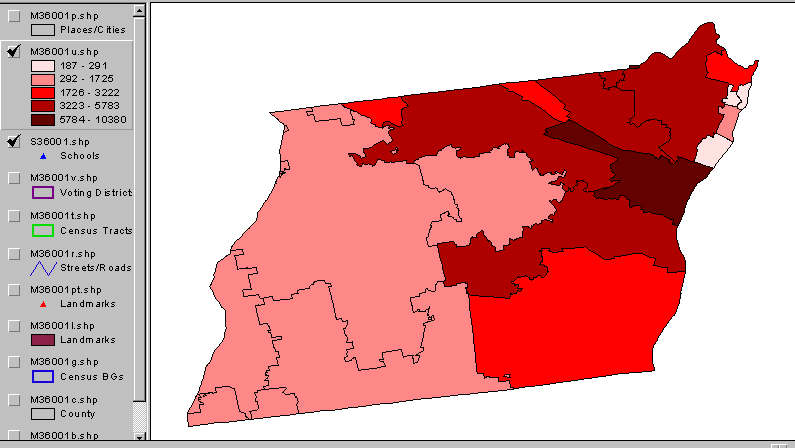
The map now shows a thematic pattern depicting the number of students by school district. The legend at the left indicates that the most dense red represents districts with a total number of students of 5,784 or more. Looking at the map, only one school district is in this interval. Attributes of a selected area. To look at attributes of the school district with the largest number of students, set the mouse feature to the information icon located on the third menu bar at the far left. Click once on the i-circle icon. Now click once on the map in the area of the district having the largest number of students. The following screen view appears showing a table with attributes of the Albany City School District. Use the scroll bars to view detailed attributes of the district. 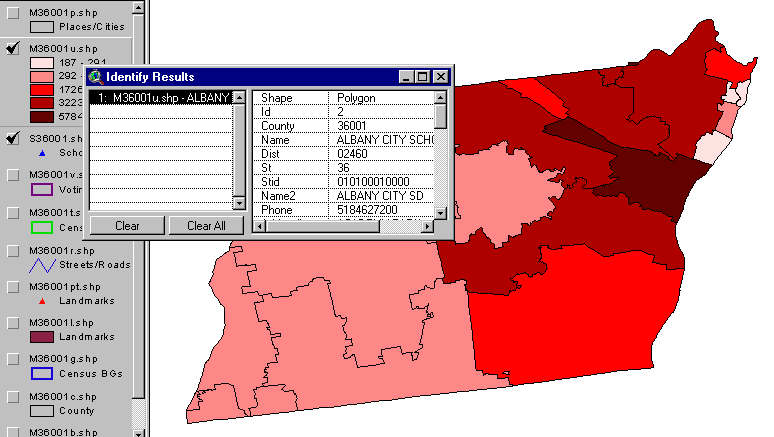
Set the You can go through the above process and choose your own variables to analyze. Showing names and labels. Using the legend editor, click on legend type and select graduated color. Using the classification field, select std_total (total students). A distribution chart appears. Click on Apply and you will see the map now shows these colors. Close the legend editor box. Click on the top menu bar, Theme and then select auto-label. The names of the school districts appear. Label font too large? To reset the font label, you will have to reset the legend type to single symbol, then choose that symbol in the legend editor, set the ABC font value size to 10, and click apply/ok/close. Then to review the thematic patterns, you will have to repeat the above steps. If labels are on, click on Theme and remove labels. With the editor windows closed, select Theme and then Auto-label. The smaller font labels appear. 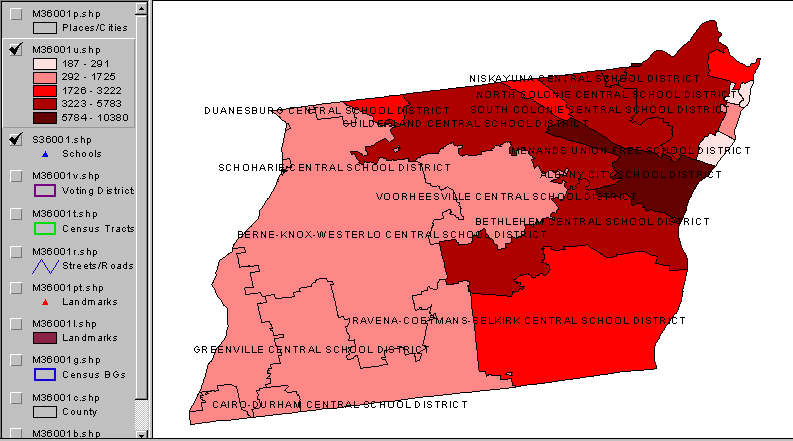
A closer look Using the zoom-in tool, view the downtown Albany area with selected features and schools shown. The display would appear as follows: 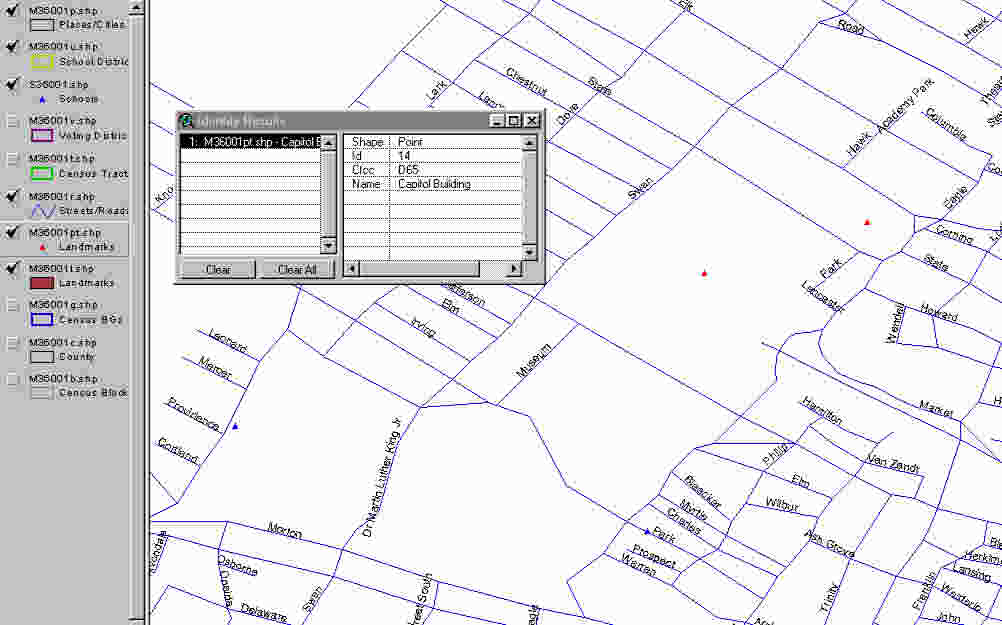 More screen displays and narrative will be added. These resources should be very valuable to mapping users who are already familiar with ArcView. If you have questions about these applications/resources Contact Proximity. [goto top] |
|
|