
|
|
|
Changing Patterns in U.S. Metropolitan Area Population
Projections to 2020. How will metros change over the next 12 years? Proximity has developed metropolitan area population projections that use different models and assumptions. See the MSA population ranking table to view the July 1, 2000 estimates, new July 1, 2007 estimates, and July 1, 2020 population projections. Largest 10 MSAs based on 2007 Population -- view all MSA ranking table 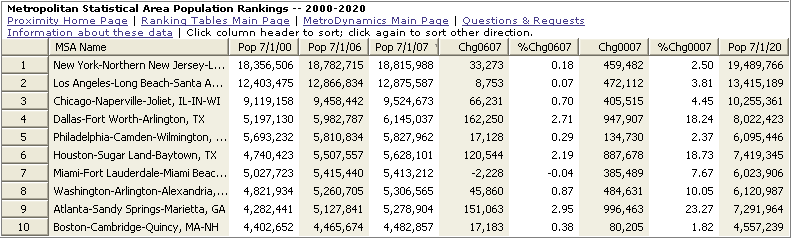
Largest 10 MSAs based on Population Change, 2000-07 -- view all MSA ranking table 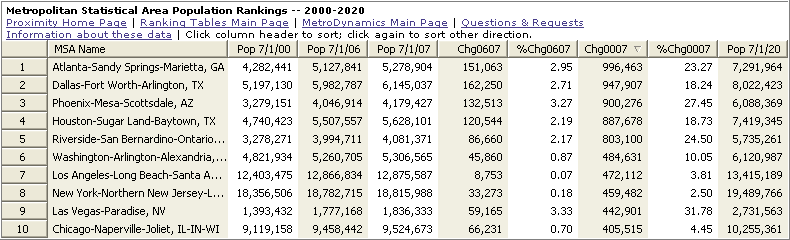
Largest 10 MSAs based on Population Percent Change, 2000-07 -- view all MSA ranking table 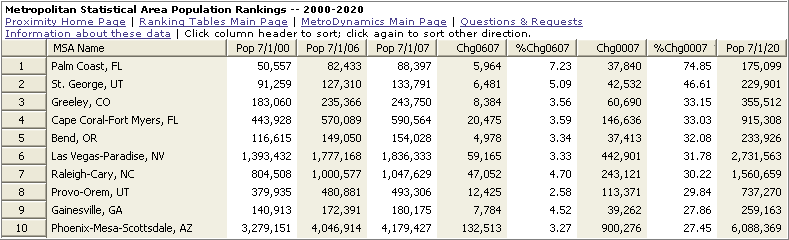
Visual Pattern Analysis. The following map views illustrate how the CommunityViewer software can be used to view/analyze metropolitan area population change. The next two maps show the population change 2000 to 2007 for the combined set of Core-Based Statistical Areas (CBSAs) -- Metropolitan Statistical Areas (MSAs) and Micropolitan Statistical Areas (MISAs). Use the CV or other GIS software to flexibly view subject matter items of interest to you for the selected MSAs or MISAs of interest, optionally in combination with other geographies. MSAs & MISAs by Population Change 7/1/2000 - 7/1/2007 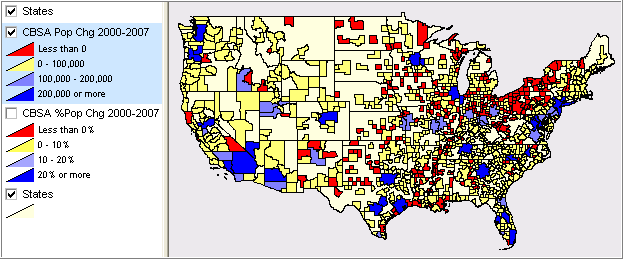
MSAs & MISAs by Percent Population Change 7/1/2000 - 7/1/2007 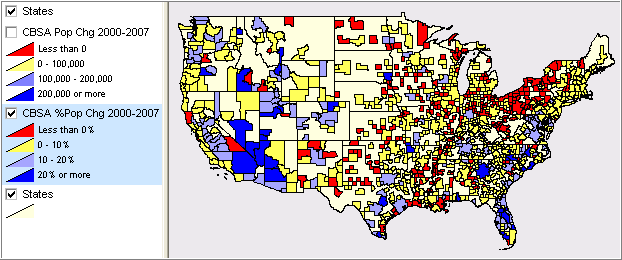
CBSA Demographic Trends Shapefile & GIS Project Create analytical views such as the one shown above to meet your needs. Click the BuyNow button to order the CBSA Demographic Trends Shapefile with projection to 2020 ($495). The file will be delivered electronically. See the related section on subject matter fields included in the shapefile. About Metropolitan Areas Using OMB definitions, U.S. metropolitan areas are categorized as Metropolitan Statistical Areas (MSAs) and Micropolitan Statistical Areas (MISAs). Metropolitan Statistical Areas may contain Metropolitan Divisions (MSA-MDs) when certain conditions are met. In addition, Consolidated Statistical Areas (CSAs) exist and are comprised of two or more MSAs and/or MISAs. See http://proximityone.com/metros.htm for more information. goto top |
|
|