|
|
School District Demographics Census 2000 Disability Data |
Special Education Decision Making Information -- using geodemographics and geospatial analysis
Geodemographics and geospatial analysis can be used to facilitate development and use of special education decision making information in many new and powerful ways. This section reviews sources and uses of these resources in the context of applications in Washington, D.C. An emphasis is placed on analyses focused on communities, neighborhoods, school districts, and related local and regional geographic areas. Answers to Questions. How many teachers, aides, and related staff are needed at individual schools to respond to the needs of special education students? Where should specialized facilities/centers be placed that provides for more optimal access by youth with disabilities? How should facilities be configured at each school to accommodate demands and needs from neighborhoods served? How can funding be put into place to facilitate meeting these needs. Geodemographics and geospatial analysis provide important resources to answers these questions. Geodemographics. Data from Census 2000 provide new insights into the characteristics of the population who have disabilities and their living environment. Subject matter questions new to Census 2000, differing from data collected in the 1990 Census, enable researchers, policy makers and stakeholders to obtain more insights into the needs and issues relating to the population with disabilities. See the relevant questionnaire section to see what questions were asked. In September 2002, new "richer demographics" data from Census 2000 became available down to the block group level of geography and for all higher level geography. In the case of Washington, D.C., there are 457 census block group areas covering the D.C. compared to 188 census tracts -- there is much greater geographic granularity available making more relevant analytical capacity for school attendance areas and neighborhoods. See the scope of data tabulations to see what data are available at the census block group and census tract levels of geography. Census 2000 demographics must be integrated with administratively collected and tabulated data to provide the basis for the most effective planning and analysis. Much of this must come directly from the school system. Geospatial Analysis. Figure 1 shows how these data can be visualized through the use of dynamic maps prepared using geographic information system (GIS) software. It is easy to see the distribution of the population 5-to-20 years of age with disabilities for small geographic areas throughout the D.C. area. This map is enabled by Census 2000 geodemographics in two ways: 1) the demographic data are taken from the Census 2000 Summary File 3 tabulations, and 2) the geography, the map files themselves, are developed from the Census 2000 TIGER/Line digital map files. Figure 1. Washington, DC by Census Block Group -- population 5-to-20 years of age with disabilities [see reference notes] 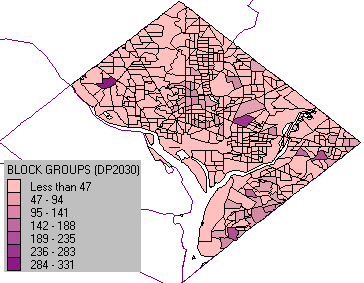
By clicking on an additional "layer", the locations of public schools can be overlayed onto the same thematic map as shown in Figure 2. Figure 2. Washington, DC by Census Block Group with Public Schools -- population 5-to-20 years of age with disabilities [see reference notes] 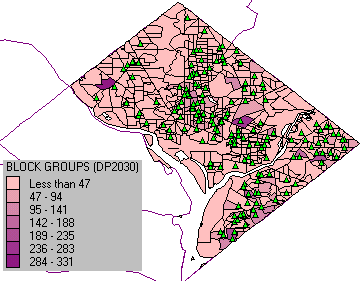
The maps shown above were displayed using mapping software and a specially prepared mapping project/data which can be downloaded for a first-hand look at the power of using these types of resources. Software and data reviewed in this document could be the basis for a more fully developed set of analytical resources. These resources could be shared by the school system with other departments, committees, and stakeholders to demonstrate progress and provide continuing updates as might be desired. Results of using the tools, such as the map graphics or spreadsheets, might be used in a range of communications to illustrate the state of children with disabilities in Web pages and other means. Resources to Make Thematic and Reference Maps. To see how these applications can operate on your computer, download the DCPS geodemographics/mapping project zip file referenced below. Expand this file into the folder c:\p1dcps and then use software such as ArcView or ArcExplorer to view the data in the form of thematic or reference maps. If you do not have mapping software use the no fee ArcExplorer software, also referenced below. Installing application on your computer ... 1 - Download ArcExplorer and install 2 - DCPS Geodemographics Map Project zip file and expand into c:\p1dcps folder The dbase file associated with the block group shapefile, included in item 2 above, contains the - DP2 subject matter items (http://proximityone.com/dp2.htm), - DP3 subject matter items (http://proximityone.com/dp3.htm), and - total population, total housing units and other selected items. Users of the block group shapefile, referenced in item 2 above, should refer to these web pages for the description corresponding to shorter item names used in the dbase file. Note that resources referenced on this page have been prepared for use with associated face-to-face tutorial. Start ArcExplorer Start>Program Files>ESRI>ArcExplorer2 (for more information on using AE2, go to http://www.esri.com and search arcexplorer2) File>Open>c:\p1dcps\p1dcps.aep What the Geodemographics and Geospatial Analysis Can Reveal Viewing Locations of Special Education Students. Using the street network as a geographic base file (included in the map project), the user can "address-match" address oriented data such as addresses of special education students. In the process of address matching, the latitude-longitude associated with the street address may be used to display icons depicting specific locations. Figure 3 shows the results of this process by address matching a single address. This process could have made use of several hundred addresses. Figure 3. D.C. Public Schools Administration Building Location -- icon located and highlighted through address matching 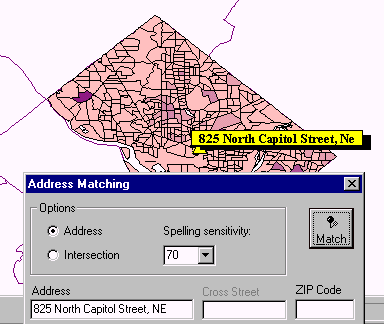
The locations of special education students could be shown on these maps to facilitate allocation of resources. By seeing where these students are located, it is easier to understand the physical location and attributes of neighborhoods in which they live. Since this can be performed on one PC, the process can be very controlled and confidentially maintained. Pattern Recognition. Combining address-matched data, such as schools and/or special education students, brings more relevance to thematic maps. For example, by zooming into a study area such as depicted in Figure 4, it is easy to see attributes of schools or students in proximity to areas of high need or incidence. Figure 4. Zoom into the Capital Area -- mixing various types of symbols and layers to assess specific issues 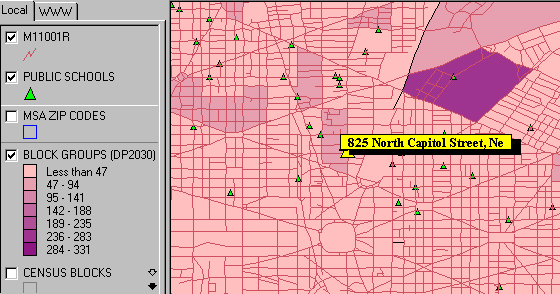
Test scores, grades, and other measures of the student's educational development could be integrated into the database.
Flexibly Viewing Up-to-Date Data. Figure 5 provides a closer look at a hypothetical study area. Through use of the GIS, it is easy to examine locations at any scale anywhere in the metro. Not only compare how DCPS is doing internally, compare how DCPS relates to other regional school systems. Figure 5 shows school names and street names. Street address ranges could be added. This map has not been edited for qualitative improvement. Figure 5. Further Zoom with More Detail 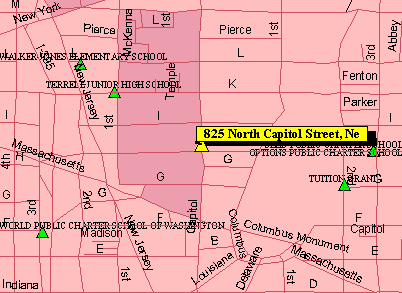
Accessing a Similar Map via Internet. A map similar to the one shown in Figure 5 can be accessed via the Census Bureau Factfinder web site (http://factfinder.census.gov). This version of the map appears in Figure 6. Unlike the map shown in Figure 5, it is not possible to add non-Census data to the map from the Census Bureau Factfinder (such as school icons/points, attributes of schools, other address data, or non-census map files such as wards, neighborhoods, or school attendance zone boundaries). Figure 6. Map Similar to Map in Figure 5 from Census Factfinder 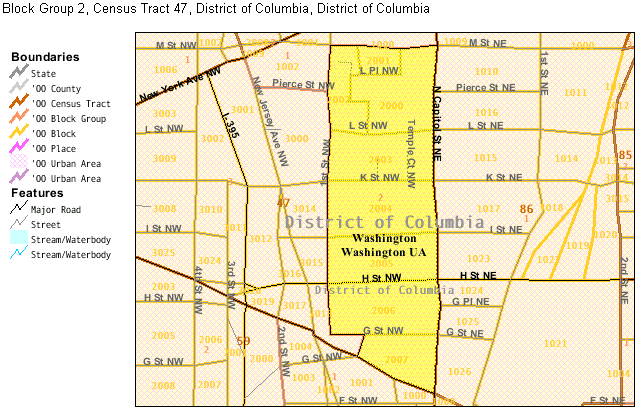
Accessing Census 2000 Demographics via Internet. Wide-ranging demographic data pertaining to special education are accessible at no fee via the Census Bureau Factfinder web site (http://factfinder.census.gov). The following table shows data from Census 2000 Summary File 3, Table P41, for the three census block groups comprising census tract 0047. Block group 2 is the area immediately to the west of the DCPS administration building location shown in the map in Figure 5 and highlighted in yellow in Figure 6. Figure 7. Summary File 3 Table P41 Data for Block Groups in D.C. Tract 0047 Population by Age by Type of Disability for the Civilian Noninstitutionalized Population 5 Years and Over with Disabilities
Broadening the Scope of Analytical Tools. A GIS provides an important window through which we can effectively visualize and examine many aspects and interrelationships of the data. GIS applications need to be augmented though display/analysis of the data using spreadsheets, such as shown in Figure 8, as well as other software. In Figure 8, the schools dbase file that is the "shapefile dbf" has been opened directly using Excel. It is easier to analyze some aspects of the data for a school or set of schools in a spreadsheet as complimented by the map view. Figure 8. Examining the Same Data in Spreadsheet Context 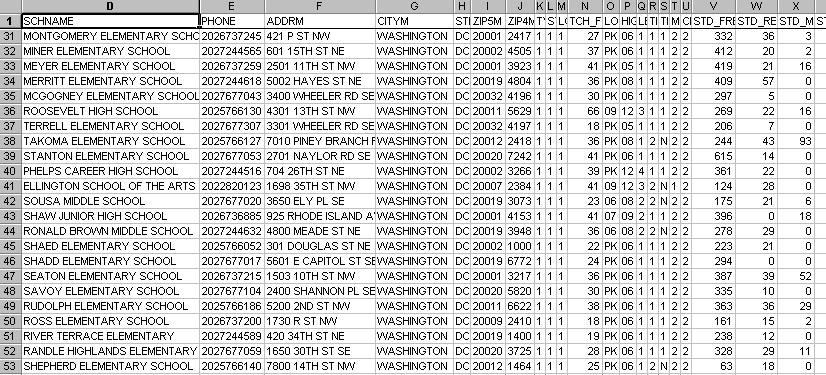
Census 2000 Disability Data [goto top] Disability status. Most of the material in this web page is focused on data for the noninstitutionalized civilian population 5-to-20 years of age who have a disability. The interval 5-to-20 years is used because of the way the data are collected and tabulated from Census 2000, and because it most closely relates to K-12 school age children. More extensive disability data are available from Census 2000 as described below. For Census 2000, people 5 years old and over are considered to have a disability if they have one or more of the following: (a) blindness, deafness, or a severe vision or hearing impairment; (b) a substantial limitation in the ability to perform basic physical activities, such as walking, climbing stairs, reaching, lifting, or carrying; (c) difficulty learning, remembering, or concentrating; or (d) difficulty dressing, bathing, or getting around inside the home. In addition to the above criteria, people 16 years old and over are considered to have a disability if they have difficulty going outside the home alone to shop or visit a doctor's office, and people 16-64 years old are considered to have a disability if they have difficulty working at a job or business. Scope of Census 2000 Disability Data. The types of data on disability from Census 2000 are limited by the scope of disability related questions contained in the questionnaire. The primary disability questions excerpted from the "long form" questionnaire are presented below. See the Census 2000 long form questionnaire (PDF) for details. 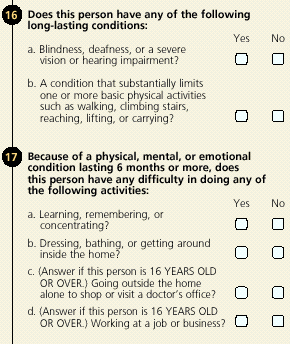
Data Tables Containing Disability Data. Based on data provided from completed questionnaires, the Census Bureau tabulates summary data for various types of geographic levels and makes these data available for general public use. The table presented below lists the "data tabulation tables" in Summary File 3 that relate directly to disability. Note that data in "PCT" tables are not available at the block group level of geography, but are available for all higher level tabulation geography (smallest area is census tract or ZIP code). Data for "P" tables are available at the block group level of geography and all higher level tabulation geography. The number in the brackets indicates how many subject matter items are included in that table.
Detailed Summary File 3 Table/Item Descriptions. P41. AGE BY TYPES OF DISABILITY FOR THE CIVILIAN NONINSTITUTIONALIZED POPULATION
5 YEARS AND OVER WITH DISABILITIES [19]
Universe: Total disabilities tallied for the civilian noninstitutionalized
population 5 years and over with disabilities
Total disabilities tallied:
Total disabilities tallied for people 5 to 15 years:
Sensory disability
Physical disability
Mental disability
Self-care disability
Total disabilities llied for people 16 to 64 years:
Sensory disability
Physical disability
Mental disability
Self-care disability
Go-outside-home disability
Employment disability
Total disabilities tallied for people 65 years and over:
Sensory disability
Physical disability
Mental disability
Self-care disability
Go-outside-home disability
goto tables
P42. SEX BY AGE BY DISABILITY STATUS BY EMPLOYMENT STATUS
FOR THE CIVILIAN NONINSTITUTIONALIZED POPULATION 5 YEARS AND OVER [49]
Universe: Civilian noninstitutionalized population 5 years and over
Total:
Male:
5 to 15 years:
With a disability
No disability
16 to 20 years:
With a disability:
Employed
Not employed
No disability:
Employed
Not employed
21 to 64 years:
With a disability:
Employed
Not employed
No disability:
Employed
Not employed
65 to 74 years:
With a disability
No disability
75 years and over:
With a disability
No disability
Female:
(Repeat AGE BY DISABILITY STATUS BY EMPLOYMENT STATUS)
goto tables
PCT26. SEX BY AGE BY TYPES OF DISABILITY FOR THE CIVILIAN NONINSTITUTIONALIZED POPULATION
5 YEARS AND OVER [101]
Universe: Civilian noninstitutionalized population 5 years and over
Total:
Male:
5 to 15 years:
With one type of disability:
Sensory disability
Physical disability
Mental disability
Self-care disability
With two or more types of disability:
Includes self-care disability
Does not include self-care disability
No disability
16 to 20 years:
With one type of disability:
Sensory disability
Physical disability
Mental disability
Self-care disability
Go-outside-home disability
Employment disability
With two or more types of disability:
Includes self-care disability
Does not include self-care disability
Go-outside home and employment only
Other combination
No disability
21 to 64 years:
With one type of disability:
Sensory disability
Physical disability
Mental disability
Self-care disability
Go-outside-home disability
Employment disability
With two or more types of disability:
Includes self-care disability
Does not include self-care disability
Go-outside home and employment only
Other combination
No disability
65 years and over:
With one type of disability:
Sensory disability
Physical disability
Mental disability
Self-care disability
Go-outside-home disability
With two or more types of disability:
Includes self-care
Does not include self-care
No disability
Female:
(Repeat AGE BY TYPES OF DISABILITY)
goto tables
PCT27. SEX BY AGE BY SENSORY DISABILITY BY EMPLOYMENT STATUS FOR THE CIVILIAN
NONINSTITUTIONALIZED POPULATION 5 YEARS AND OVER [49]
Universe: Civilian noninstitutionalized population 5 years and over
Total:
Male:
5 to 15 years:
With a sensory disability
No sensory disability
16 to 20 years:
With a sensory disability:
Employed
Not employed
No sensory disability:
Employed
Not employed
21 to 64 years:
With a sensory disability:
Employed
Not employed
No sensory disability:
Employed
Not employed
65 to 74 years:
With a sensory disability
No sensory disability
75 years and over:
With a sensory disability
No sensory disability
Female:
(Repeat AGE BY SENSORY DISABILITY BY EMPLOYMENT STATUS)
goto tables
PCT32. SEX BY AGE BY EMPLOYMENT DISABILITY BY EMPLOYMENT STATUS FOR THE CIVILIAN
NONINSTITUTIONALIZED POPULATION 16 TO 64 YEARS [31]
Universe: Civilian noninstitutionalized population 16 to 64 years
Total:
Male:
16 to 20 years:
With an employment disability:
Employed
Not employed
No employment disability:
Employed
Not employed
21 to 64 years:
With an employment disability:
Employed
Not employed
No employment disability:
Employed
Not employed
Female:
(Repeat AGE BY EMPLOYMENT DISABILITY BY EMPLOYMENT STATUS)
goto tables
PCT33. SEX BY DISABILITY STATUS BY SCHOOL ENROLLMENT BY EDUCATIONAL ATTAINMENT FOR THE
CIVILIAN NONINSTITUTIONALIZED POPULATION 18 TO 34 YEARS [47]
Universe: Civilian noninstitutionalized population 18 to 34 years
Total:
Male:
With a disability:
Enrolled in school:
Below college
College or graduate school
Not enrolled in school:
Not high school graduate
High school graduate (includes equivalency)
Some college, no degree
Associate degree
Bachelor's degree
Graduate or professional degree
No disability:
(Repeat SCHOOL ENROLLMENT BY EDUCATIONAL ATTAINMENT)
Female:
(Repeat DISABILITY STATUS BY SCHOOL ENROLLMENT BY EDUCATIONAL ATTAINMENT)
goto tables
PCT34. SEX BY AGE BY DISABILITY STATUS BY POVERTY STATUS FOR THE CIVILIAN
NONINSTITUTIONALIZED POPULATION 5 YEARS AND OVER [59]
Universe: Civilian noninstitutionalized population 5 years and over for whom
poverty status is determined
Total:
Male:
5 to 15 years:
With a disability:
Income in 1999 below poverty level
Income in 1999 at or above poverty level
No disability:
(Repeat POVERTY STATUS)
16 to 20 years:
(Repeat DISABILITY STATUS BY POVERTY STATUS)
21 to 64 years:
(Repeat DISABILITY STATUS BY POVERTY STATUS)
65 years and over:
(Repeat DISABILITY STATUS BY POVERTY STATUS)
Female:
(Repeat AGE BY DISABILITY STATUS BY POVERTY STATUS)
goto tables
PCT67A. AGE BY TYPES OF DISABILITY FOR THE CIVILIAN NONINSTITUTIONALIZED POPULATION
5 YEARS AND OVER WITH DISABILITIES (WHITE ALONE) [19]
Universe: Total disabilities tallied for the civilian noninstitutionalized
White alone population 5 years and over with disabilities
Total disabilities tallied:
Total disabilities tallied for people 5 to 15 years:
Sensory disability
Physical disability
Mental disability
Self-care disability
Total disabilities tallied for people 16 to 64 years:
Sensory disability
Physical disability
Mental disability
Self-care disability
Go-outside-home disability
Employment disability
Total disabilities tallied for people 65 years and over:
Sensory disability
Physical disability
Mental disability
Self-care disability
Go-outside-home disability
goto tables
PCT68A. SEX BY AGE BY DISABILITY STATUS BY EMPLOYMENT STATUS FOR THE CIVILIAN
NONINSTITUTIONALIZED POPULATION 5 YEARS AND OVER (WHITE ALONE) [49]
Universe: White alone civilian noninstitutionalized population 5 years and over
Total:
Male:
5 to 15 years:
With a disability
No disability
16 to 20 years:
With a disability:
Employed
Not employed
No disability:
Employed
Not employed
21 to 64 years:
With a disability:
Employed
Not employed
No disability:
Employed
Not employed
65 to 74 years:
With a disability
No disability
75 years and over:
With a disability
No disability
Female:
(Repeat AGE BY DISABILITY STATUS BY EMPLOYMENT STATUS)
goto top |
|