|
|
|
Voting Rate Patterns
In the 2008 presidential election, 64 percent of voting-age citizens voted, similar to that of 2004, but higher than the presidential elections of 2000 and 1996. Overall, 131 million people voted in 2008, a turnout increase of about 5 million people since 2004. During this same 4-year period, the voting-age citizen population in the United States increased by roughly 9 million people. In 2008, 71 percent of voting-age citizens were registered to vote, a decrease compared to the 72 percent who were registered in 2004. The 2008 election had a higher registration rate than the presidential election of 2000, but was not statistically different from the 1996 rate. Overall, 146 million people were registered to vote in 2008, an increase of approximately 4 million people since 2004. The ranking table presented below shows voting rates for 2004 and 2008 use by state based on the November 2008 Current Population Survey. See notes below table describing the column headers. Voting Rates by State: 2004-2008 Ranking Table Click column header to sort; click again to sort other direction. See related Ranking Tables Main Page. Numbers are in thousands. Column headers: (all data are for citizens) Voted 04 -- total voted 2004 %Voted 04 -- percent voted 2004 MOE 04 -- percent voted 2004 -- margin of error Voted 08 -- total voted 2008 %Voted 08 -- percent voted 2008 MOE 08 -- percent voted 2008 -- margin of error %VotedChg 04-08 -- change in percent voted 2004 to 2008 Voting Rate Changes by States: 2004–2008 by State The thematic map presented below shows patterns of the voting rate changes by states from 2004 to 2008. The CommunityViewer (CV) identify tool (see pointer) is used to click on an area to display a mini-profile. The mini-profile shows that same data for the state (Utah) as shown in the ranking table. 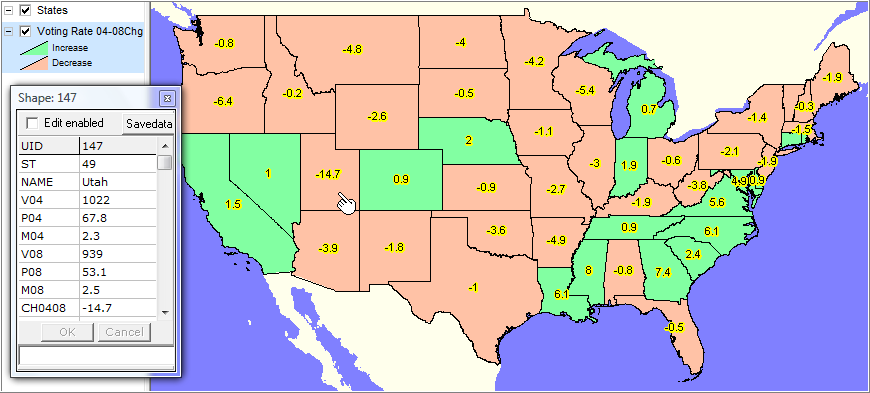
Additional Information Proximity develops geodemographic/economic data and analytical tools. We help organizations knit together and use diverse data in a decision-making and analytical framework. We develop custom demographic/economic estimates and projections, develop geographic and geocoded address files, and assist with impact and geospatial analyses. Wide-ranging organizations use our tools (software, data, methodologies) to analyze their own data integrated with other data. Contact Proximity (888-364-7656) with questions about data covered in this section or to discuss custom estimates, projections or analyses for your areas of interest. |
|
|