

|
|
Congressional Districts Main Page CDViewer Main Page Incumbent Views |
CDViewer -- visual analysis of congressional districts Zoom-in to specific states or districts. This view shows Missouri congressional districts. 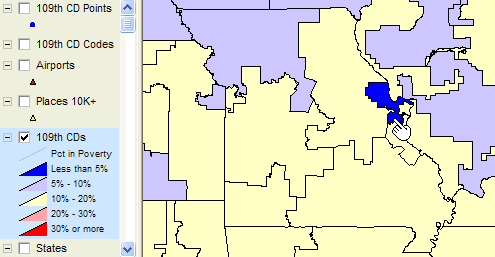
Note in the above view, the layer named "109th CDs" is checked. Layers checked are displayed in the map window. This layer shows the thematic pattern of percent population in poverty by 109th Congressional District. Darker blue shows lower percent in poverty; Darker red shows higher percent in poverty. The dark blue Missouri district is in the interval with the lowest percent in poverty. The identify tool is used (see pointer in above map) to display a profile of a selected district (darker blue St. Louis area district) that is displayed on the screen. The profile is shown below.
Additional Sample Views The next set of views shows examples of using the standard layers. These layers are listed in the legend panel: • 109th CDs as blue markers or points • 109th CDs as outlines with CD Number • Airports as red triangle markers • Places/cities 10,000+ population yellow markers • 109th CDs as thematic pattern • U.S. by State boundaries The next view shows the 109th CD outline with code layer. 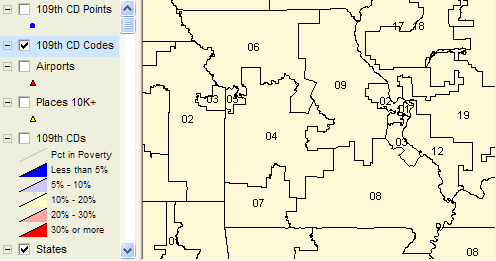
The next view shows the state outline and 109th CD points. 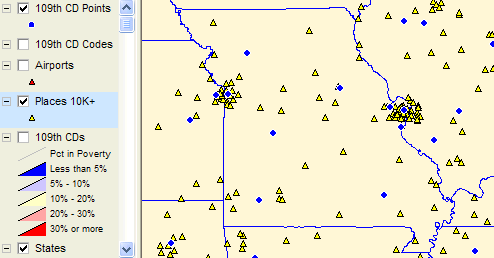
In the next view, the airport layer is clicked on and added to the above view. 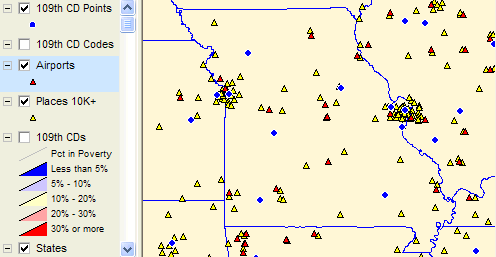
The next view shows counties to further contextualize the view. 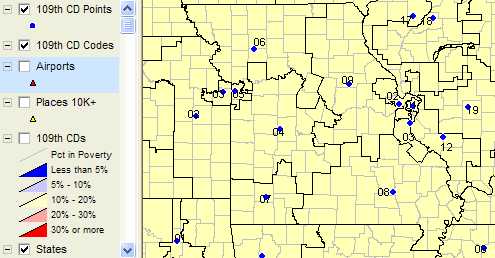
Incumbents by Name and Districts. The next view shows Houston, TX area districts with incumbent name used to label district markers. Note the county outline as semi-transparent boundary to view in context of district boundaries. 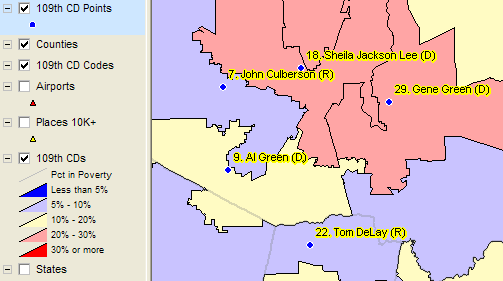
Similarly, the next view shows Los Angeles, CA area districts with incumbent name used to label district markers. Some names do not appear as option set to avoid overlapping labels. 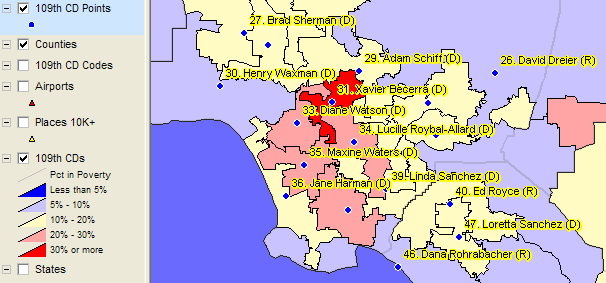
[goto top] |
|
|