|
|
CV LUCA Main Page Web-Based Geodemographics & Atlanta, GA Area |
CommunityViewer & Census 2010 LUCA Program This section illustrates use of the CommunityViewer software in the context of the Census 2010 LUCA program. Use of Proximity/Google interactive geodemographics tools are also reviewed. These applications are focused on the City of Atlanta but apply to any city or governmental jurisdiction participating in LUCA. The next view shows Atlanta City (green fill pattern) with census tract boundaries (green boundaries). 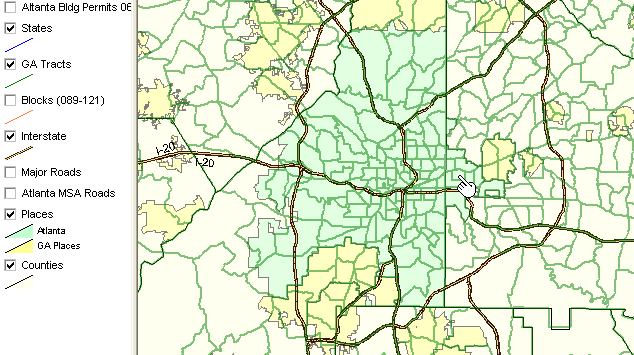
Same as previous view with 2006 building permits (address list file) as points. The red dots, or markers, are the locations of building permits issued in 2006 in Atlanta city. The address-based data were geocoded using CommunityViewer and a shapefile was created enabling the addresses to be viewed on a map. In this application, the building permits file might be considered to be a proxy for the LUCA "address list file." Even though the field names differ, the concepts and operations are similar. In the most basic level of LUCA participation, mapping of the address list file is not required. However, these views show how the addresses can be mapped and used in a visual analysis mode as well as tabular data file (as distributed by Census). 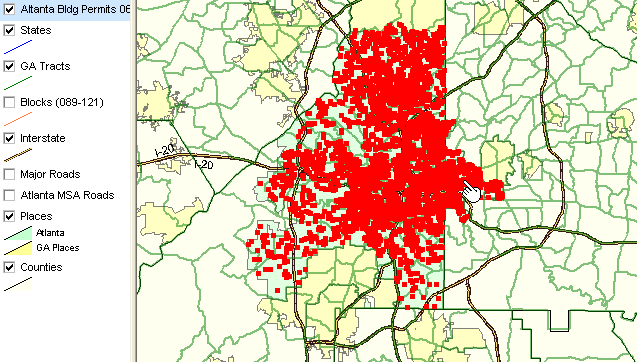
Same as previous view with census block boundaries (red boundaries) -- (proxy for address count file) 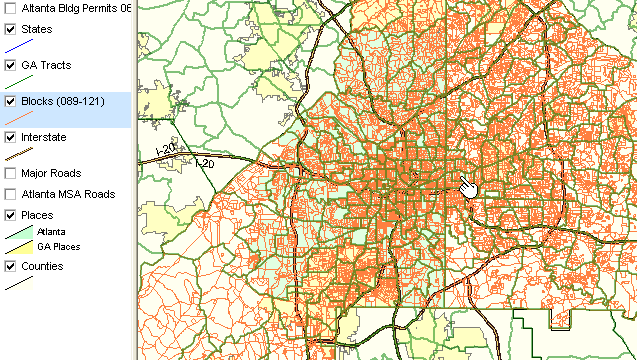
Zoom-in view to location (tract) shown in previous view at pointer -- counts (housing units) made visible as label in each block -- streets layer turned on -- identify tool used to click on a block and show profile 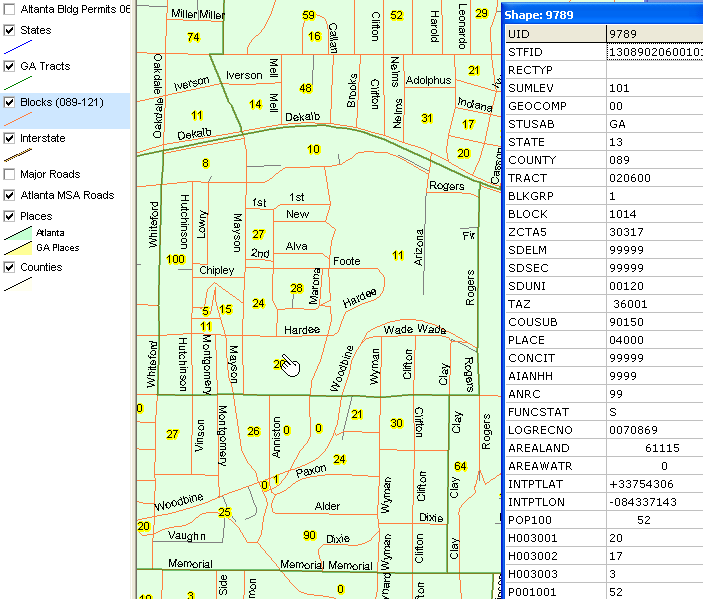
Same as previous view; address list file made active -- identify tool used to click on a structure and show profile 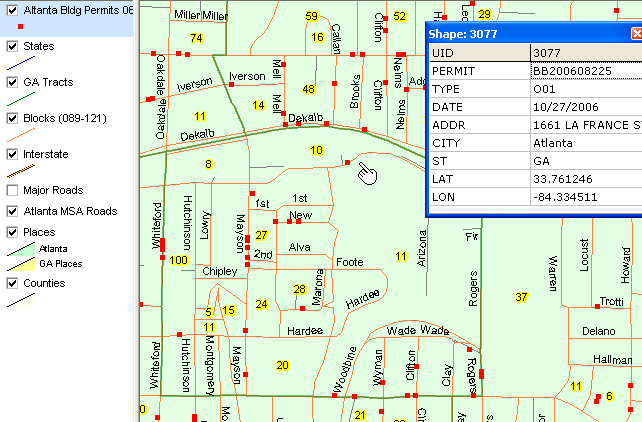
Tools>dBrowse is used to view/manipulate address list file The address list file is sorted on a selected field (permit) 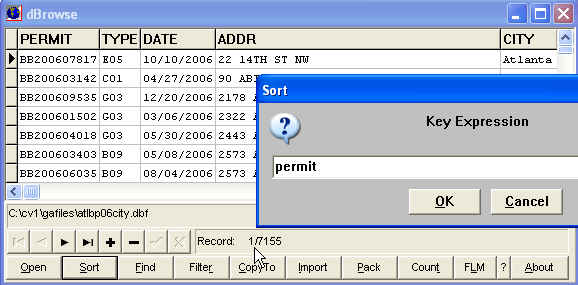
After sorting a Find operation is used to locate the address profiled in the map above (by value of sort key field) 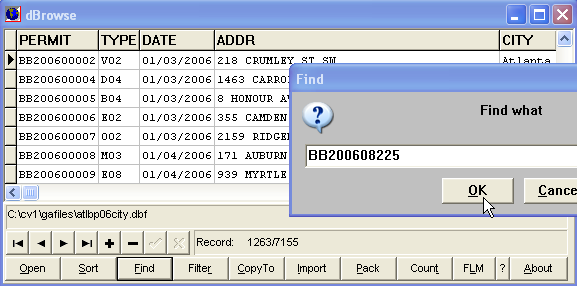
The record is located/displayed as shown below 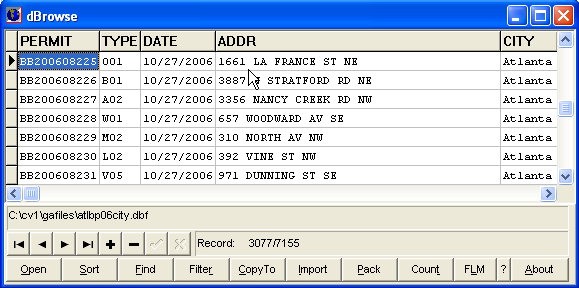
The record can be directly edited as shown below -- the word 'edited' is keyed into the field. 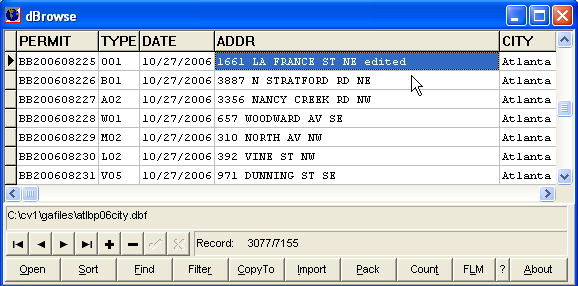
The address list file is closed. Back in the map view, the identify tool is used to show that the street address field now contains the retained term 'edited.' This demonstrates how easy it is to sort the address list file on a filed of interest, locate a record by a key value, and then modify the field value in that record. 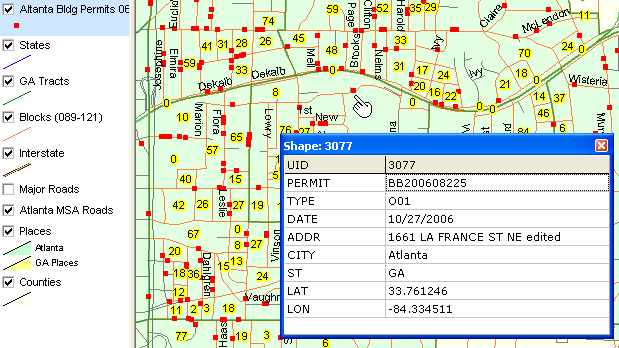
Unrelated directly to the LUCA program, use CommunityViewer features to meet ongoing analytical needs. The next view shows a thematic map of median household income by block group for the Atlanta area. 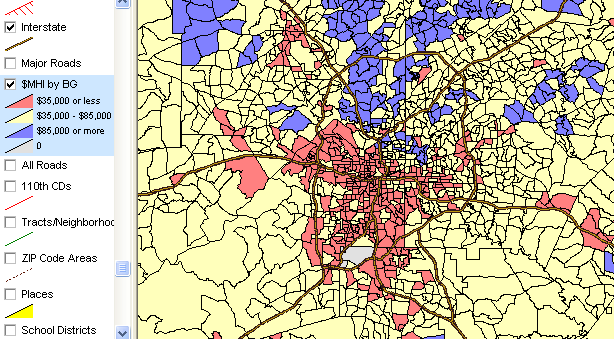
Proximity/Google Interactive Geodemographics. Tools, operations and Web pages reviewed in this section illustrate use of the Proximity/Google API interactive mapping applied to the DeKalb County area to review topics associated with the LUCA Program. • Census Blocks in DeKalb County Tract 0206: http://proximityone.com/luca13089b.htm Using these tools, you can view rooftop level detail in the context of political and statistical geographic areas and access related demographics -- all using Web-based tools. These tools do not replace the PC-based LUCA-related tools and operations but may be useful for accessing related detail regarding LUCA operations. Tract by Block. Click the Census blocks link -- http://proximityone.com/luca13089b.htm. A new window appears showing tract 020600 in DeKalb County. The census blocks are shown with blue boundaries. These boundaries are based on the census blocks shapefile reviewed in the CV project described earlier on this page. An XML file is generated for the census blocks boundary file using the Proximity Shp2XML tool. The red markers are located at the geographic centroid of the census block. Use the mouse tool to pass over a red marker and observe how the marker reveals the block code. Note the irregularly shaped census block boundaries to the south of Chipley St. These boundaries are the current depictions in the TIGER (TGR 2006 SE) derived shapefiles. 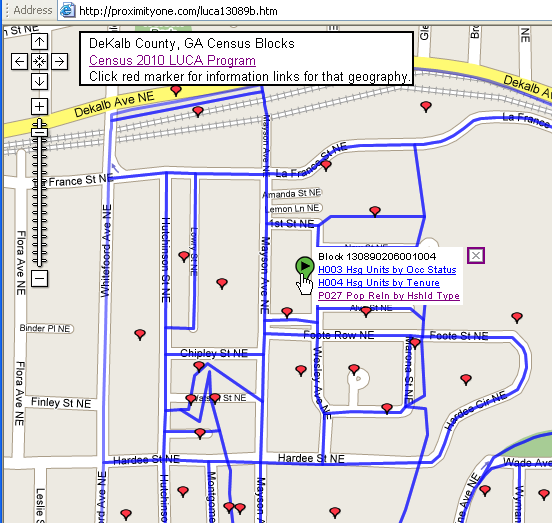
Click the red marker as shown in the above view. It turns green and the mini-html table appears. Click the link for Table P27. Table P27 is accessed using the Census Bureau FactFinder. The table shown below appears in a new browser window. Try this for any block and any table. 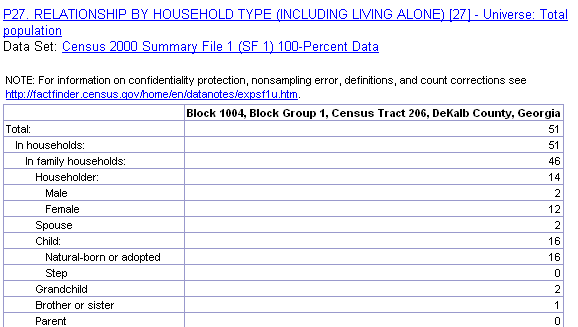
In the browser window showing the Google map, click the upper right "hybrid" button. The screen refreshes and shows rooftop level building structures. Block boundaries still in the view. Using this tool you can see where and what types of structures exist in the context of census blocks. Note the following depiction is a graphic. To view a Web page where you can actually click a red marker review other information presented on this page. 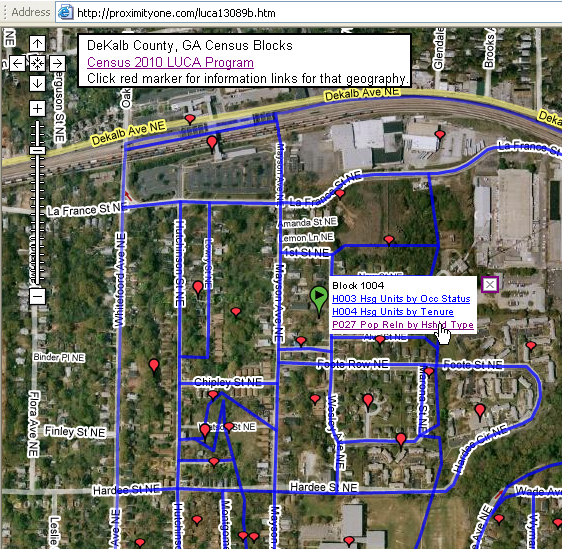
[goto top] |
|
|