|
|
|
Spring Branch ISD, Texas -- Attendance Area Demographics & Map Project Tutorial This section summarizes uses of mapping and GIS software tools for Spring Branch ISD (SBISD), Texas attendance area demographic data and associated map files. This tutorial was developed for use in the School District Demographics and Analysis Workshop. The purpose of the tutorial is two-fold. First, it provides a summary of SBISD attendance area demographic data (developed by Proximity for Spring Branch ISD) that can be used in self-guided dynamic analyses of school and sub-district level geography. By going through the tutorial, other data views, geography, and subject matter that may be of interest to you can be pursued. Second, by proceeding through a set of operational steps making use of the data, the processes and potentials for using the broader capabilities of GIS become clearer.
If the files are not placed in the folder c:\m4841100, the operations will still work. However, some adjustments will be necessary to get the application start-up to appear as shown here. Contact support if you have questions. Summary of Themes/Shapefiles and Roles. The graphic that appears above shows a list of several themes (shapefiles) in the left column. Each of these themes is described in the table presented below.
Each school attendance area shapefile contains attendance area demographic data as summarized in the table at http://proximityone.com/dp2000et.htm. In the above graphic, a theme is shown in the map window the map if the theme checkbox (beside the theme name) is checked. In this example, SBISD HS AAs and SBISD MS AAs are not checked and do not appear. View Three Attendance Area Boundaries. These steps summarize how to view the three AA shapefiles.
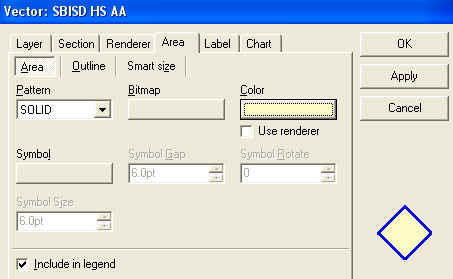
Set the Outline to a width of 3.1. Click Apply and OK. 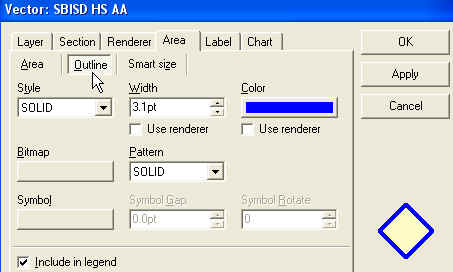
Modify SBISD MS AA setting the outline width to 2.1. Click Apply and OK. The map should now appear as shown below. 
View Individual Attendance Area Boundaries -- by Type of Attendance Area. From the above map, click on/off the layers to obtain the following views. Elementary School Attendance Areas. Click on the Harris Unified Districts layer. This provides a "background." Now make SBISD ES AA active, dbl-click layer name, and assign labels showing ES AA names. 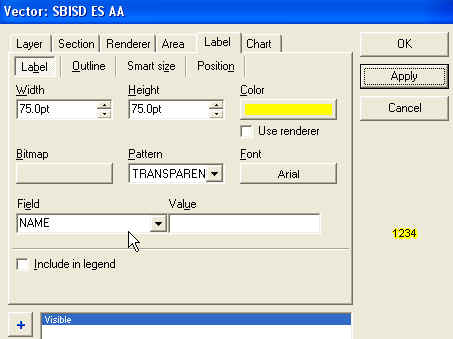
The map now appears as shown below. 
To center label positions and other attributes, bring up the editor once again, change Label>Position (5 and center) and check off Allow Overlap. 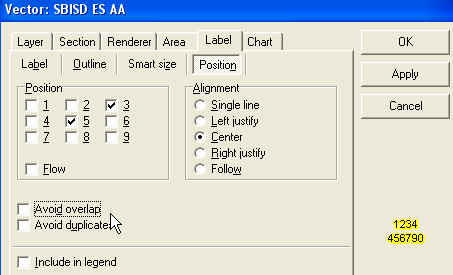
The map now appears as: 
Experiment with other attendance area themes to gain experience and better understand options and features. View Thematic Map of District by Elementary Attendance Area -- Any Subject Matter Item.
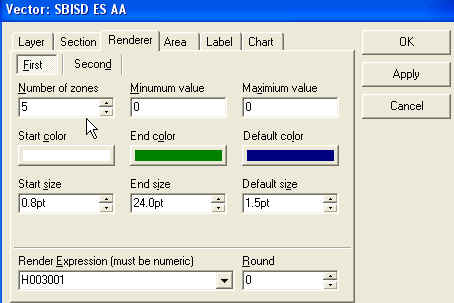
Click Apply and OK and the map appears: 
Interpreting the Map. The legend properties for SBISD ES AA shown different patterns associated with different values (intervals) of data on the number of housing units by ES attendance area. It is observed that the upper left and lower right ES AAs have the largest number of units. There are several ways to show how many housing units are in an ES AA. Label the areas with the H003001 data values: 
View Attributes of a Selected Attendance Area The identify tool can also be used to view attributes of a selected polygon/ES AA. Click the identify tool button on the toolbar and then click in the lower right ES AA. (first click off the Harris Unified Districts layer.) 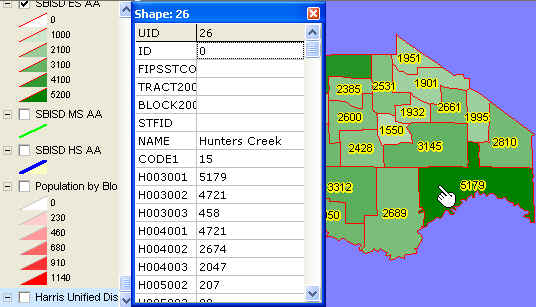
Look at other data on your own. Choose from any of the subject matter items included in the shapefile. The list of item names and descriptions is provided at http://proximityone.com/dp2000et.htm. View Attributes of a School
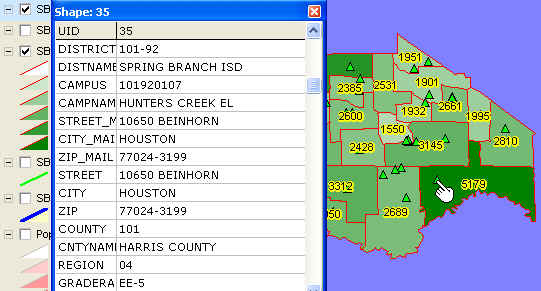
To recap, the previous steps have reviewed how to examine characteristics of a school in context of the attendance area (and its characteristics) where the school is located. View Attributes of a Street
 Using and Interpreting Street Attributes. The street segment attributes shown above describe features of the street segment between two intersections. It can be observed that the "from address right side" (FRADDR) of this street segment is 10600 and the "to address right side" (TOADDR) is 10688. The school address (see above) is 10650 Beinhorn. These descriptions show how USPS addresses of schools (or students) relate to the streets shapefiles and street segment on the earth surface. View Census Block Demographics in the School Vicinity Click the Population by Census Block layer on. Click the SBISD ES AA layer off (it "covers up" the block layer) The following SBISD by census block thematic map appears. 
The census block profiled, to the south of the school, has 82 housing units. 80 are owner occupied. This census block would be referred to (and uniquely identified) with the geocodes: census block 2013 in census tract 430300 (or 4303.00) of county 201 (Harris) in state 48 (Texas). If the roads layer is turned off, the location and boundary of the block can be observed as shown below. 
Saving Your Project Save the existing settings by using File|SaveProjectAs and save the project to c:\m4841100\m4841100hunters.gpr. You can then recall this view as the starting position. Try that operation to see how it works. Close and then File|Open and select the GPR just saved. Attendance Area Demographics [goto top] Each of the attendance area shapefiles (m4841100eaa, m4841100maa, and m4841100haa) include attendance area demographic data developed by Proximity. Field names that may be selected for viewing are summarized in the right column of the subject matter description table located at http://proximityone.com/dp2000et.htm. To view these data in a tabular manner, it is recommended that the Excel version of the data be used. The Excel files cannot be used by ArcExplorer. A separate operation using Excel is required to view the Excel formatted attendance area demographics. These files are provided separately and named in the manner m4841100?aa.xls -- where ? takes on the values: e for elementary school attendance areas, m for middle school attendance areas, and h for high school attendance areas. In the Excel file, columns are provided for each attendance area and a summary for district for "extended DP1" subject matter fields as described in the table at http://proximityone.com/dp2000et.htm. Codes used for attendance areas ("Zone XX") are the same as the attendance area codes assigned by SBISD. Specification of subject matter items included in the attendance area demographics "DP1" data follow the set of items used by the Census Bureau summary reports containing these same subject matter items for all counties and states (not school districts nor lower level geography). The county and state data may be accessed via http://factfinder.census.gov. Choose Datasets>Summary File 1>Quick Tables>DP1. One notable exception to this is the single year of age by gender data included in the Proximity "extended DP1" dataset (not available in the Census Bureau DP1 set). Subject matter definitions are available in the PDF documentation located at http://www.census.gov/prod/cen2000/doc/ProfileTD.pdf. See descriptions that pertain to DP1 items. [goto top] |
|
|