|
|
|
Philadelphia-Camden-Vineland, PA-NJ-DE-MD CSA -- Regional & Local GeoDemographics School Districts & Children's Demographics How has the "relevant children" population in Philadelphia CSA school districts changed since Census 2000? Applications reviewed on this Web page are used in the GeoDemographics WebCourse and are focused on the Philadelphia-Camden-Vineland, PA-NJ-DE-MD Combined Statistical Area (CSA). See main page for overview. The CSA contains parts or all of 132 school districts (a few school districts extend beyond county boundaries that comprise the CSA; school district boundaries shown the maps have been clipped at the CSA boundary). Pennsylvania, Maryland, and Delaware contain unified school districts only. New Jersey has elementary, secondary, and unified school districts. Unified (green) and Elementary (yellow) School Districts 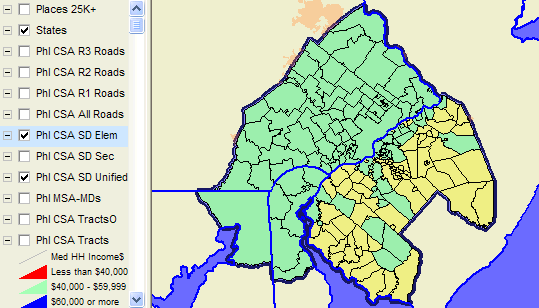
Unified (green) and Secondary (blue) School Districts 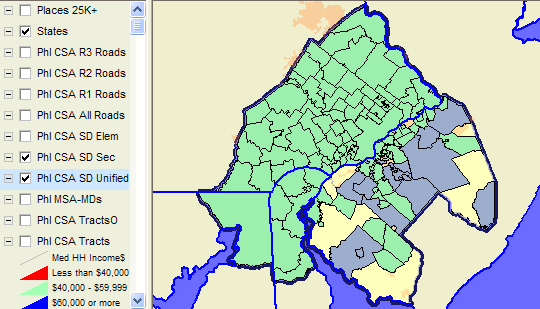
School District Demographic Trends. The next views show how Philadelphia CSA school districts are changing since Census 2000. See the description of the school district demographic trends used in these analyses. Unified and Elementary School Districts -- percent change in relevant children ages 5-to-17 years of age (RC517) from 2000 to 2003 The legend at the left shows the colors used to represent different levels of percent change by school district. Districts that appear in red experienced a decrease in RC517. 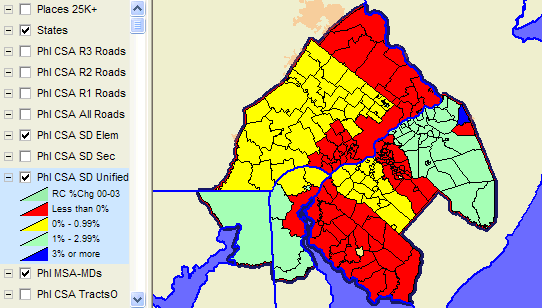
Unified and Secondary School Districts -- percent change in relevant children ages 5-to-17 years of age (RC517) from 2000 to 2003 The legend at the left shows the colors used to represent different levels of percent change by school district. The same percent change interval values are used for elementary, secondary, and unified. Districts that appear in red experienced a decrease in RC517. 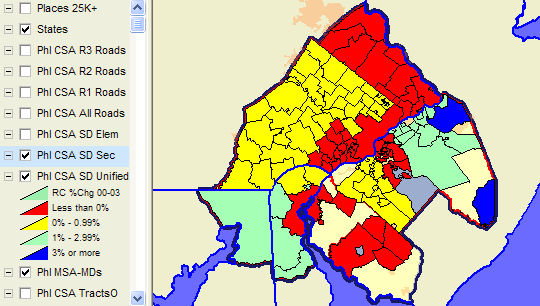
Largest Districts The largest 10 school districts in the CSA, based on 2003 total relevant population ages 5-to-17 years of age are listed in the following table. The spreadsheet showing all school districts with annual data for population, relevant children, and children in poverty is provided to workshop registrants. 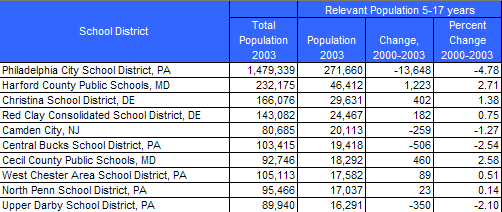
Comparative Analysis Demographic Profiles How do these districts differ in terms of socioeconomic composition? The Proximity 4-part comparative analysis demographic profile provides answers and insights. The profile was prepared for 3 similarly sized districts: • Camden City, NJ school district • Central Bucks School District, PA • Cecil County Public Schools, MD See the comparative analysis Camden-Central Bucks-Cecil County Profile (Excel) to compare and contrast these districts. Even though these districts are similar in size of the relevant population ages 5-to-17, the demographic composition is radically different. Note that this XLS file is 4-worksheet file. Click on sheetname tabs at the bottom of the spreadsheet to view the separate DP1, DP2, DP3, and DP4 profiles. Register for the geodemographics workshop and acquire these profiles for districts of interest to you. [goto top]
|