|
|
DTCA Main Page 2003 Vintage Metro Summaries Hawaii County Demographic Trends |
Metropolitan Area Demographic Trends Register to receive a snapshot of how your metro is changing ... similar to the following profile for the San Francisco-Oakland-Fremont, CA MSA shown in the following graphic. 
Use the DTCA software and database to obtain much more detail.

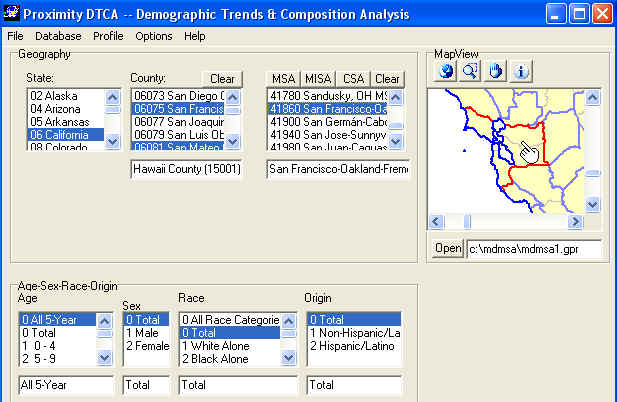
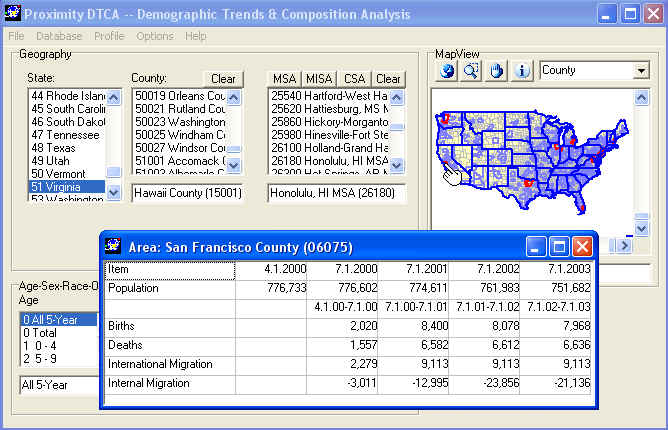
Using Map Viewer Tools One U.S. map project is distributed with DTCA. The project file name and location are c:\mdmsa\mdmsa1.gpr. The user never modifies the project file. It is managed in the background by the DTCA software. When the Open button under the map window is clicked, the project file is opened. The map viewer opens to the 48-state view (zoom to full extent using tool to view Alaska and Hawaii). Four map files (shapefiles) are displayed in the map view window in a layered manner: U.S. by state, county, MSA, and MSA-MD. In the next graphic, the ActiveLayer is set to County. Next the Identify tool (i) is selected. The hand pointer is placed over San Francisco County, CA and click left displays the county components of change profile. 
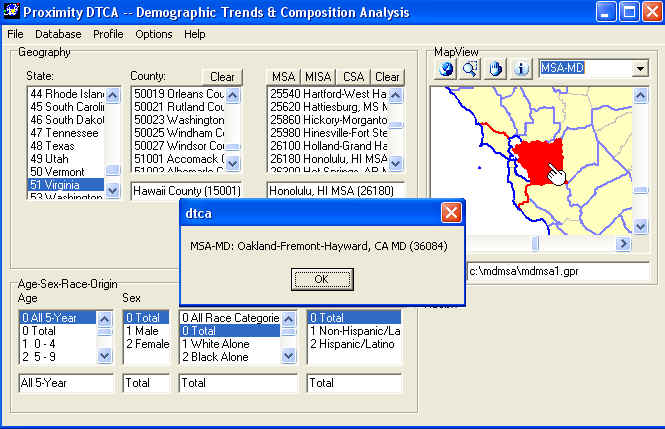
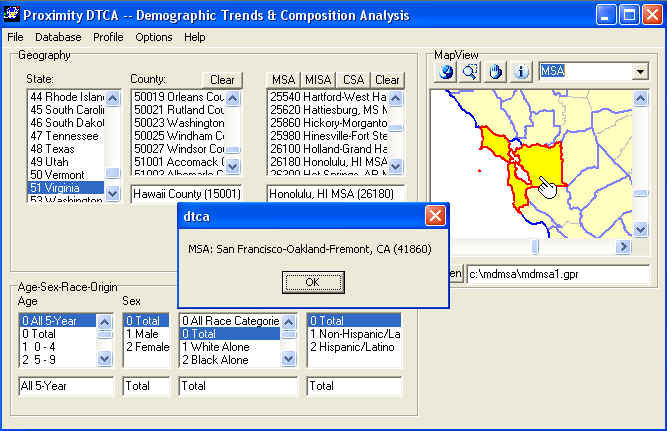
A primary purpose of the maps and tools is to enable a flexible way to see what counties comprise metros and to identify a metro by visual proximity rather than name or code. Examples of selecting the MSA-MD and MSA layers as active layers, and then using the Identify tool to select and identify are demonstrated in the following graphics. 

[goto top] |
|
|