|
|
Healthcare DMI |
HealthCareAnalyst
Despite the attention being given to a U.S. health care reform, it is very challenging to analyze characteristics of the health care market/industry. Will Medicare funds "run-out" in 11 years? How large is the Medicare base in your county/region(s) of interest? How might the population be impacted in these areas? Compared to other areas? The U.S. Health Resources and Services Administration (HRSA) Area Resource File (ARF), updated annually, contains multi-sourced data on several thousand health care-related measures at the county level. The HealthCareAnalyst software makes it easy to access the ARF data -- without any data conversion. Use features of the HealthCareAnalyst software to integrate other data with data in the ARF resource. HealthCareAnalyst updates enable users to directly analyze data contained on current and future editions of the ARF disc (not distributed by Proximity, available via HRSA). The HealthCareAnalyst (HCA) software enables use of the ARF and other data and examine characteristics the healthcare market and industry composition and trends. • Flexibly choose from the more than 6,000 subject matter items and create your own profile. • Easily select any county and view a health care characteristics profile based on your criteria. • The same health care characteristics profile is also written as an Excel file for further use. • Export data from the very large ARF database into dBase structure for use with other applications. • Examine health care patterns using inetgrated MapViewer, CommunityViewer, or other GIS software. • With almost no learning, you are able to immediately start using HCA. • Optionally integrate data from other sources. Using the HCA main form, click on a county to view a time series profile of selected items for the area. In the following HCA view, the Tools>MapView has been selected to display a thematic map. 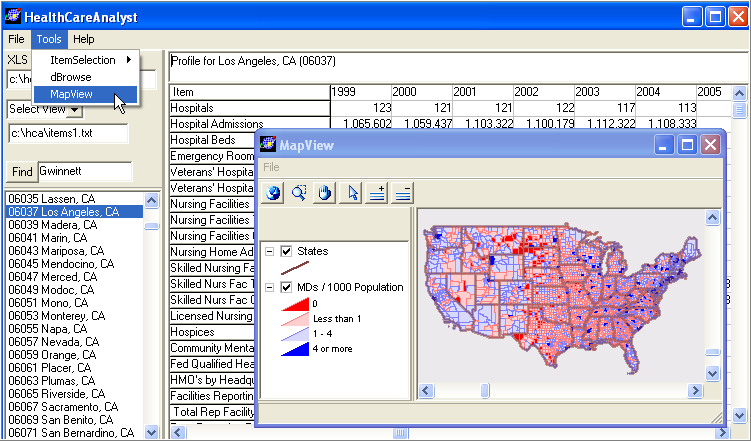
The map is shown in greater detail below. Map any of the ARF subject matter items or other data in your project. 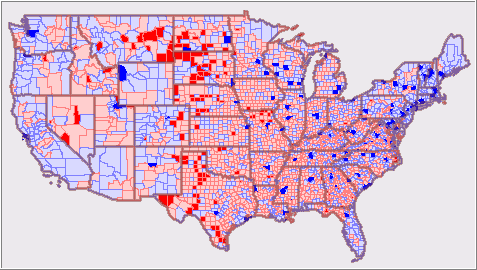
The above CV map shows the number of MDs per 1,000 population for the U.S. by county. Darker red: no MDs, light red: 1 MD per 1,000, light blue: 1-3 MDs per 1,000, dark blue: 4 or more MDs per 1,000 population (based on 2005 data). Zoom into a region of interest. Use the Identify tool to view a county profile. This view shows a mini-profile for Los Angeles County. The subject matter items are a combination of ARF sourced data (MD fields) and other fields. 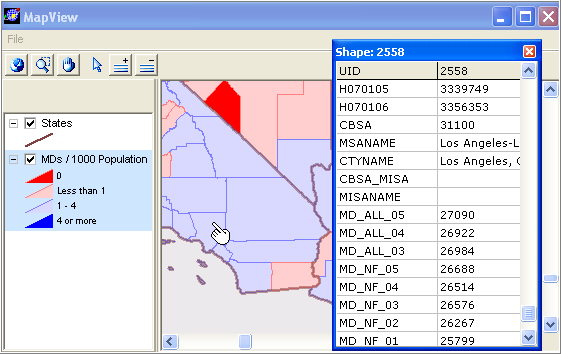
Contact Proximity for more information. |
|
|