|
Geospatial Relationships
|
  
|
|
Geospatial Relationships
|
|
This section provides examples of mixing multiple geographies and subject matter, in the main not covered elsewhere.
| • | Water Areas |
| • | Landmark Areas |
| • | Congressional Districts and Voting Areas |
| • | Military Areas |
| • | County Subdivisions |
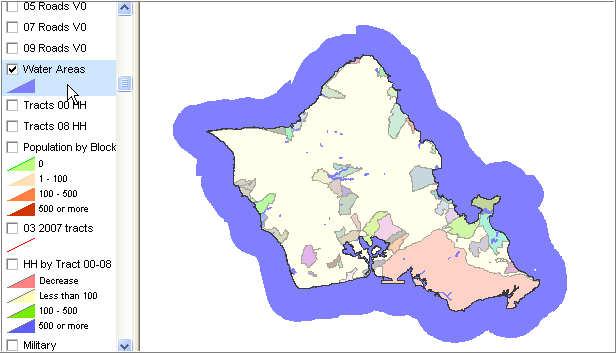
Water Areas
Water Areas are hydrology polygons. Hydrology lines are identified in the edges shapefile. Water Areas extend to the three-mile territorial limit as shown in blue in the following view:
The GIS backgroundcolor view is set to matching color using the File>Project editor:
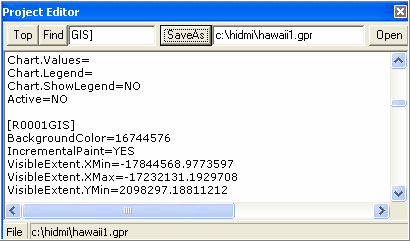
and using the color code 16744576 determined using the MapView>Colors>Pick from Screen.
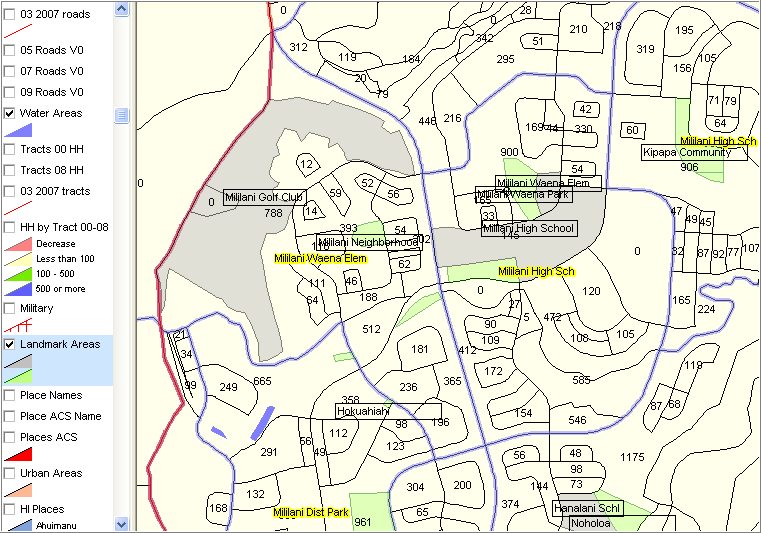
Landmark Areas are useful to view many types of areas.
The following view shows golf courses, parks, school grounds (black bordered transparent labels) shown in context of other geography as described below as Congressional Districts and Voting Districts View 2. Yellow labels, as described below, are voting districts (blue boundary).
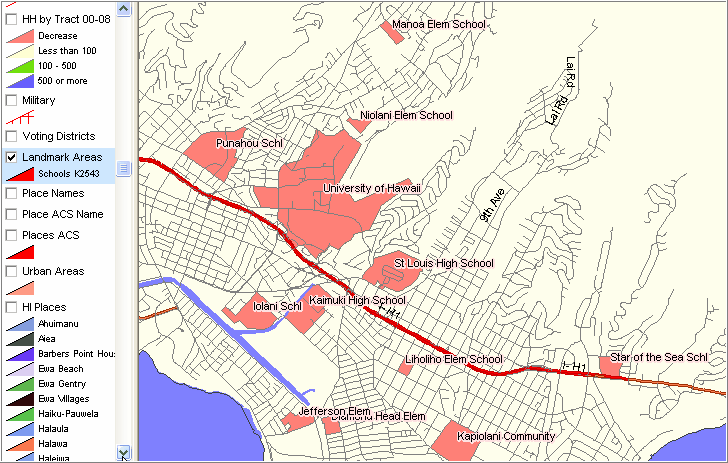
Landmark Areas - View 2 - Schools
Landmark Areas use the MTFCC feature code (list). The code 'K2543' is used to identify school landmark areas. The following view shows an example of landmark school areas based on this code. While this view shows use of this code is not comprehensive, it also shows the areas designated in context of streets and is a useful resource to extend development of 'school area footprints.'
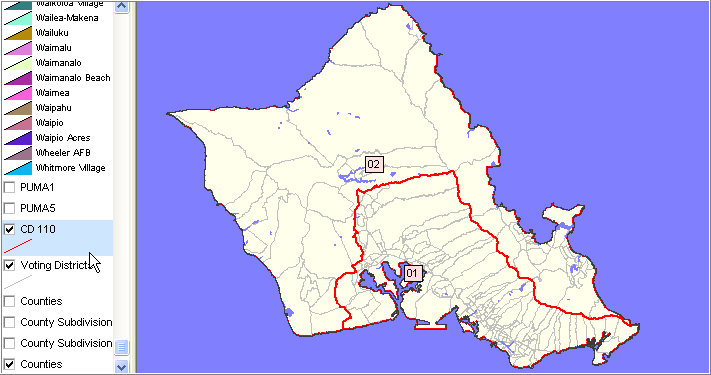
Congressional Districts (CD 110) and Voting Districts - View 1
See also http://proximityone.com/cd.htm.
Illustrates relationship viewing -- CDs and Voting Districts
CD numbers shown as labels
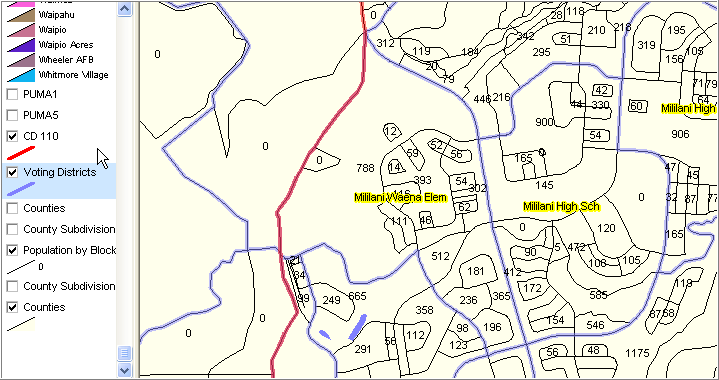
Congressional Districts (CD 110) and Voting Districts - View 2
Illustrates zoom-in to view boundary of a VTD (blue yellow label) in context of CD 110 (red) and in context of census block (black) with Census 2000 population as label.
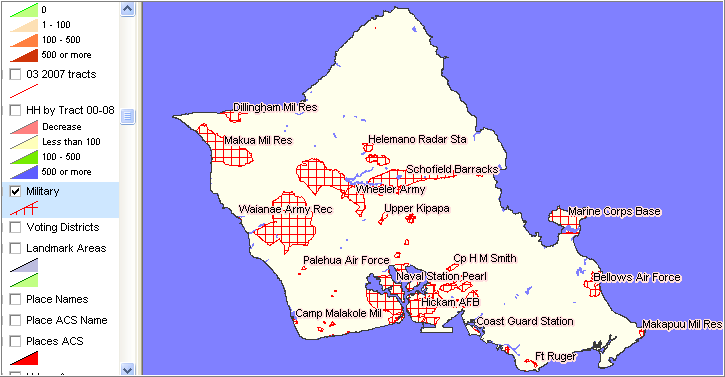
Military Areas
Illustrates use of "see through" hatch patterns. The labels operation has been set to not show overlapping labels resulting in some areas not being labeled in this view.
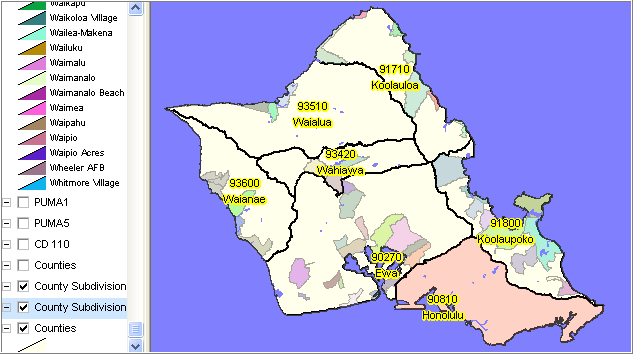
County Subdivisions
Illustrates an additional instance of the same shapefile being added as another layer, with geographic objects labeled with different fields. In this example the county subdivision code and name are shown.
Page url: http://proximityone.com/hidmi/guide/index.html?geo_relationships.htm