|
|
|
Analyzing School District Finances: School District Financial Analyst Examples of SDFA Operations The SDFA start-up screen appears as shown in the graphic shown below. Click on one or any combination of districts in the leftmost school district listbox to display a profile set. In this example the RunFromFile option (top center) has been used. Districts listed in the file "largestny.txt" are processed rather than clicking to select districts. The grid in the right section of the screen presents processing results as shown in this graphic. Detailed subject matter displays are written to the Excel file "sdf01.xls." An extended version of the summary presented in the screen below is also created as an Excel file -- see example for largest 25 school districts. 
The district list displayed on the screen is also written to an Excel file with more detail as shown below. 
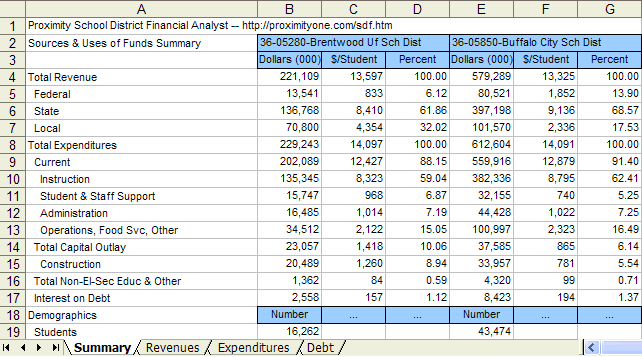
Screenshots of the 4-worksheet Excel file are shown in the next set of views. All districts are displayed as 3-column sets in the Excel file. In these views on the two leftmost districts are captured: Brentwood and Buffalo. Sheet 1 shows the summary revenues and expenditures. 
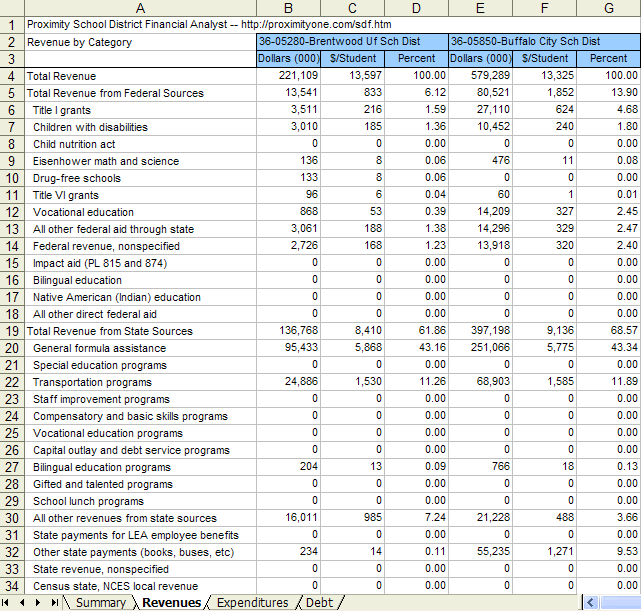
Worksheet 2 shows revenue details. 
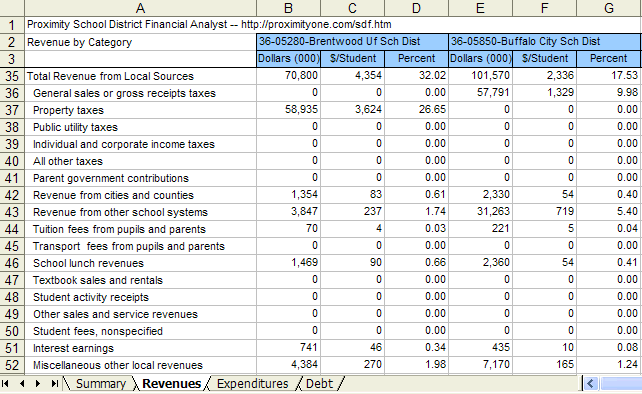
Worksheet 2 continued ... local revenue sources 
See profile worksheets 3 (expenditures) and 4 (debt). [goto top] |
|
|