|
|
|
School District Poverty Patterns |
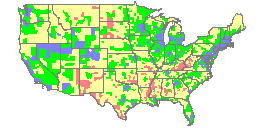
County Income and Poverty Patterns
County Income and Poverty Interactive Ranking Table Click column header to sort; click again to sort other direction. See related Ranking Tables Main Page Ranking Table Column Descriptions
2 - St -- State postal abbreviation 3 - StCty -- State+County FIPS code 4 - Pop in Pov -- Population in poverty 5 - Pop in Pov% -- Population in poverty as percent of total population 6 - Age<18Pov -- Population under age 18 in poverty 7 - Age<18Pov% -- Percent population under age 18 in poverty 8 - Age5-17Pov -- Population 5-17 years of age in poverty 9 - Age5-17Pov% -- Percent population ages 5-17 years in poverty 10 - $Md HH Inc -- Median Household Income All population estimates are as of 7/1/2007. All population values refer to population where poverty status could be determined. All data values are estimates, a margin of error can be computed for each estimate. Poverty Official Definition. Estimates of the population in poverty are developed by many Federal statistical programs. Estimates provided in the ranking table have been developed using the Census Bureau American Community Survey in combination with other data. More generally and following the Office of Management and Budget (OMB) statistical policy, the Census Bureau uses a set of money income thresholds that vary by family size and composition to determine who is in poverty. If a family’s total income is less than the family’s threshold, then that family and every individual in it is considered in poverty. The official poverty thresholds do not vary geographically, but they are updated for inflation using Consumer Price Index. The official poverty definition uses money income before taxes and does not include capital gains or noncash benefits (such as public housing, Medicaid, and food stamps). Additional Information. Proximity develops custom demographic estimates and projections. Wide-ranging organizations use our tools (software, data, methodologies) to analyze their own data integrated with other data. Contact Proximity (888-364-7656) with questions about data covered in this section or to discuss custom estimates, projections or analyses for your areas of interest. |
|
|