Interactive Geographic-Demographic-Economic Ranking Tables
Welcome! ProximityOne develops geographic-demographic-economic data and analytical tools and helps organizations knit together and use diverse data in a decision-making and analytical framework. We develop custom demographic-economic estimates and projections, develop geographic and geocoded address files, and assist with impact and geospatial analyses.
Wide-ranging organizations use our tools (software, data, methodologies) to analyze their own data integrated with other data.
Relationship Files
- not ranking tables; but related geographic relationship files.
- new category see below; adding a U.S. county-to-CBSA relationship file.
- these files are in the UserGroup Area & require a
no-fee userid - get here
State & Regional Decision-Making Information Sections
- frequently updated state-by-state data analytics and data access resources.
- visit U.S. by state main page.
Contents
This document is organized into these sections:
- links go to section in this document; optionally scroll down on the page.
Updates
This section updates frequently ... recent additions: (scroll section)
- links go to item main page; use above table to navigate within this page.
The underlying data used to develop many of these tables are available in the form of XLSX or CSV structured files.
See more about the ProximityOne Data Service 2.
Scroll section ...
• Housing Units by County U.S. by County tiem series through 2019 - 11/02/20
• Congressional Districts updated with 2019 Demographic-Economic Attributes - 11/01/20
• ZIP Code 2018 Demographic-Economic Characteristics - 10/07/20
.. 4 sections/files .. General Demographics
.. Social
.. Economic
.. Housing
• Metro Demographic-Economic Characteristics -- 2019 annual update - 09/29/20
.. 4 sections/files .. General Demographics
.. Social
.. Economic
.. Housing
• Metro Population & Components of Change
annual 2010-2019 -- 09/22/20
• County Business Patterns U.S. by County by Industry - 05/18/20
• ZIP Code Business Patterns U.S. by ZIP Code - 05/16/20
• Population & Components of Change 2010-2019 Annual U.S. by county - 05/10/20
• Quarterly Census of Employment & Wages 2019Q3 U.S. by county - 04/28/20
• School District Sources & Uses of Funds U.S. by school district - 04/09/20
• Seniors Characteristics by County 65+, 75+, 85+ - 04/06/20
• U.S. by County COVID-19 Cases
.. cases, deaths .. daily time series; this section/page introduced March 2020
• Metro Gross Domestic Product - 02/05/20
.. 2010-2018 annual time series
• Population & Components of Change by State - 01/06/20
.. 2010-2019 annual time series
• 116th Congressional District Incumbents & Demographics - 11/05/19
... http://proximityone.com/cd.htm
... new district by party/incumbency data in interactive table.
... new 2018 ACS demographics by district in interactive table.
• Personal Consumption Expenditures by Type & State - 10/28/19
.. 2010-2018 annual time series
• U.S. & State Real Median Household Income - 10/17/19
.. 2005-2018 annual time series
• American Community Survey 2018 1-Year Tabulation Areas - 09/22/19
.. ACS 2018 (release date 9/26/19) complete geography list/table with data access
• U.S. by Tract 2019 HMDA/CRA Characteristics - 09/19/19
.. FFIEC 2019 data; all tracts; wide-ranging attributes
• Combined Statistical Area Demographic Trends - 09/12/19
..
Sep 2018 Vintage; official population estimates
• U.S. by County New Authorized Residential Construction - 09/09/19
.. annual data 2015-2018; single family/multifamily; units, building, value.
• U.S. by County Monthly Labor Force Situation - 09/07/19
.. new data July 2018; monthly over year July 2017-June 2018
• U.S. by CBSA/Metro & County Components - 09/05/19
.. Sep 2018 vintage CBSAs (current); population & components of change; annual 2010-2018
• U.S. & State Annual Real GDP by Sector - 08/12/19
.. annual data 2010-2018; 91 sectors; total & per capita; updates twice (preliminary/revised) annually.
• U.S. & State Quarterly Real GDP by Sector - 08/05/19
.. quarterly data 2018q1-2019q1; 24 sectors; total & per capita; updates and extends quaterly.
• Analyzing ZIP Code Demographics - 07/15/19
.. use tools described there to create your own ZIP code demographic thematic pattern maps.
• NonEmployer Business Establishments & Receipts U.S. by county by type of business - 07/08/19
.. non-employer business establishments by industry with up to 5-digit NAICS code.
• FDIC Insured Bank by Location - 07/05/19
.. 88,000 banking locations and related institution 2018 deposit & asset characteristics.
• Business Establishments, Employment, Wages U.S. by county by type of business - 07/01/19
.. 2018 business establishments by industry with up to 6-digit NAICS code.
• Housing Price Index Quarterly Update: 2018Q1-2019Q1; U.S, State, Metro - 06/03/19
..

• Housing Units 2010-2018 new 2018 updates; U.S, State, County - 06/01/19
..

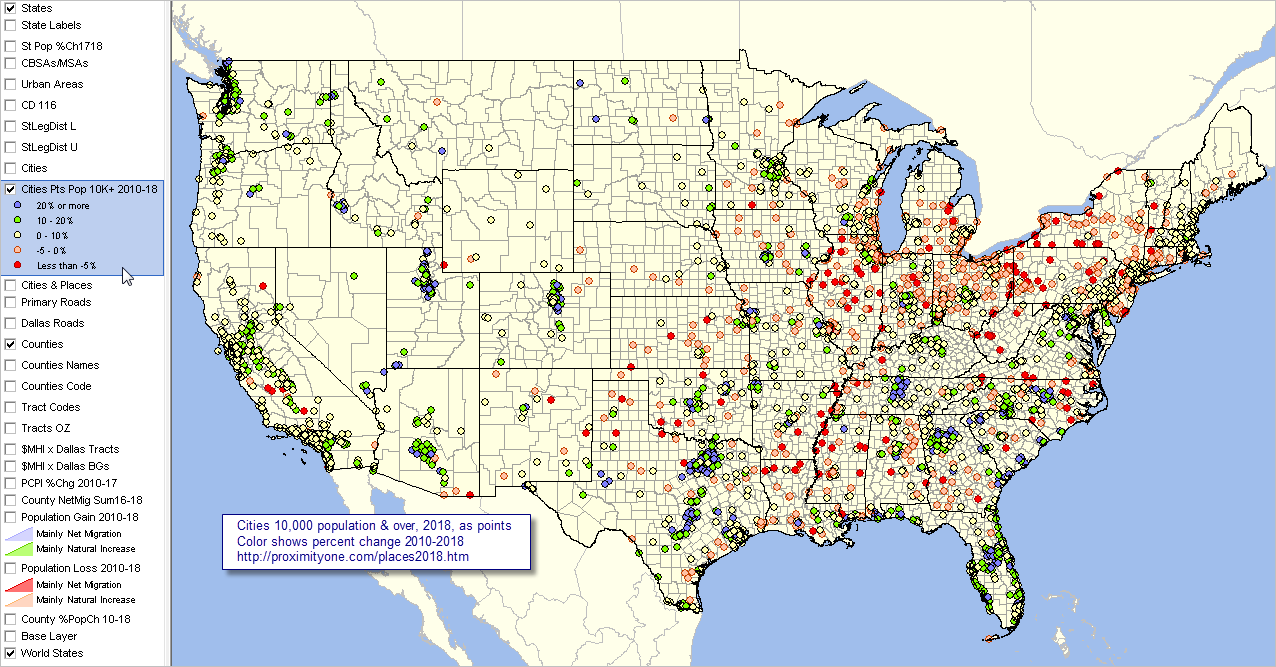
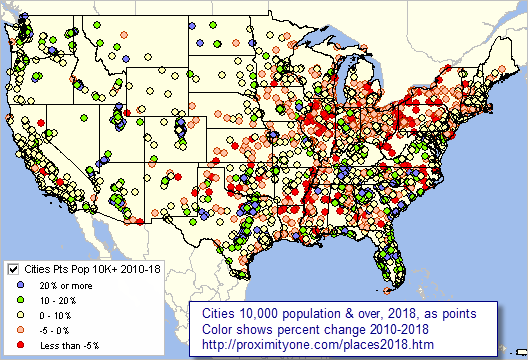
• City Population Estimates 2010-2018 new 2018 updates; 19,495 cities - 05/27/19
..
• Metro Real Personal Income/Related Measures - 2008-2017 annual - 05/20/19
• Metro Population & Components of Change: 2010-2018 - 05/06/19
.. View Metro S & O Reports via links in this table
• County Population & Components of Change: 2010-2018 - 04/27/19
.. How & Why State/County Demographics are Changing: Wichita, KS MSA example
• Census Tract
ACS 2017 Demographic-Economic Characteristics
- about census tracts
- current estimates & projections
- 03/05/19
.. 4 sections/files .. General Demographics
.. Social
.. Economic
.. Housing
• City/Place
ACS 2017 Demographic-Economic Characteristics - 02/12/19
.. 4 sections/files .. General Demographics
.. Social
.. Economic
.. Housing
• School District Geography & Geographic Size -- 01/23/19
.. 2018 School District Geographic Size
• School District
ACS 2017 Demographic-Economic Characteristics - 01/17/19
.. 4 sections/files .. General Demographics
.. Social
.. Economic
.. Housing
• Metropolitan Statistical Areas
2017 Demographic-Economic Characteristics - 01/15/19
.. 4 sections/files .. General Demographics
.. Social
.. Economic
.. Housing
• School District 2010-2017 Annual Demographic Estimates - 01/10/19
.. 2018 annual updates; all school districts; total population, school age population, school age population in poverty
• U.S. & States 2010-2018 Population & Components of Change - 01/07/19
.. 2018 estimates new and start the 2019 demographic estimates cycle
• County Gross Domestic Product - 01/05/19
.. annual estimates by sector; per capita, current and real GDP
• County-to-County Migration - 01/02/19
.. 3,142 x 3,142 county matrix origin-destination domestic migration
• U.S. by ZIP Code Area: Demographic Change since 2010 - 12/11/18
.. examine ACS2012, ACS 2017 and 5-year change
•
Census Tract - Congressional District Equivalence - 12/01/18
• Largest 1,000 School Districts 2017 Demographic-Economic Characteristics - 11/24/18
.. 4 sections/files .. General Demographics
.. Social
.. Economic
.. Housing
• U.S., State & County Economic Characteristics and Trends .. on 31 economic measures - 11/20/18
.. examine change .. view composites for individual states and counties; 2010-2017; new 2017 estimates
• Congressional District Seats, Incumbents, Attributes - 11/06/18
.. updates with Nov 2018 election results
• U.S. & States 2017 Demographic-Economic Characteristics - 10/31/18
.. 4 sections/files .. General Demographics
.. Social
.. Economic
.. Housing
• 115th Congressional Districts 2017 Demographic-Economic Characteristics - 10/22/18
.. 4 sections/files .. General Demographics
.. Social
.. Economic
.. Housing
•
2010 & 2020 U.S. House Apportionment by State (and historical apportionments) - 09/20/18
• State-to-State Geographic Mobility. 2010-2017; annual update - 07/30/18
• All U.S. Cities Population Time Series: 2010-2017; annual update - 06/07/18
• Housing Units Time Series: 2010-2017; annual update; U.S, State, Metro - 05/28/18
• Naturally Occurring Retirement Communities - update by census tract - 5/15/18
• County Business Patterns 2016 - establishment characteristics by 6-digit NAICS - 4/25/18
• Population & Components of Change: 2010-2017 U.S. by County - 03/27/18
.. How & Why State/County Demographics are Changing: Texas example .. choose any state
• Foreign Born Population by Country of Origin by Census Tract - 03/19/18
• Housing Price Index; 2010-2017 U.S., State, Metro - 03/02/18
• ACS 2016 Citizen Voting Age Population -- U.S., States & Counties - 02/28/18
.. ACS 2016 Citizen Voting Age Population -- 115th Congressional Districts - 02/28/18
.. ACS 2016 Citizen Voting Age Population -- State Legislative Districts - 02/28/18
.. ACS 2016 Citizen Voting Age Population -- Cities/Places - 02/28/18
• Children's Demographics & Living Environment by Type of Enrollment (Public/Private) by School District - 02/22/18
• Healthcare Establishments by ZIP Code by Type of Business - 02/09/18
• ZIP Code 2016 Demographic-Economic Characteristics - 02/07/18
.. 4 sections/files .. General Demographics
.. Social
.. Economic
.. Housing
.. access related ZIP Code profiles with multi-sourced data
• Cities/Places 2016 Demographic-Economic Characteristics - 01/27/18
.. 4 sections/files .. General Demographics
.. Social
.. Economic
.. Housing
• Metro 2016 Demographic-Economic Characteristics - 01/18/18
.. 4 sections/files .. General Demographics
.. Social
.. Economic
.. Housing
• Virginia State Legislative District Demographic-Economic Characteristics -- 01/05/18
• U.S. by State Population & Components of Change; annual data 2010-2017 & GIS project/datasets -- 12/22/17
• State Legislative District Demographic-Economic Characteristics -- 12/15/17
• School District Demographic Trends: 2010-2016 -- 12/03/17
• U.S. & State 2016 Demographic-Economic Characteristics - 09/27/17
.. 4 sections/files .. General Demographics
.. Social
.. Economic
.. Housing
.. features GIS tools & ready-to-use project/data
.. integrating state quarterly personal income 2010Q1 through 2017Q2
• 115th Congressional Districts 2016 Demographic-Economic Characteristics - 09/22/17
.. 4 sections/files .. General Demographics
.. Social
.. Economic
.. Housing
• Census Tract Low & Moderate Income Characteristics -- HMDA 2017 -- 8/18/17
• GDP by Industry -- U.S. state, MSAs -- 8/05/17
• State Quarterly GDP by Industry -- 8/01/17
• Texas Health Region Demographics with extended profiles -- 6/29/17
• Census Tract ACS 2015 Demographic-Economic Characteristics - 06/22/17
.. 4 sections/files .. General Demographics
.. Social
.. Economic
.. Housing
• Metro Population & Components of Change Estimates; 2010-2016 - 6/20/17
.. access to table requires User Group ID.
Join now. No fee.
• State Net Worth & Related Measures 6/7/17
• City/Place Population Annual Population Estimates; 2010-2016 - 5/27/17
•
Business Data Information System -- quarterly financial time series data -- Individual business SEC filers - 05/24/17
•
Relating ZIP Code Areas to Cities/Places -- geography & population -- U.S. by ZIP Code/place - 05/20/17
•
Change in Life Expectancy by County/Metro -- 1980-2014 -- U.S. by county/metro - 05/10/17
•
115th Congressional Districts: Analysis and Insights -- U.S. by 115th CD - 04/24/17
.. latest ACS 2015 data for currently defined 115th CDs; with party/incumbent attributes
•
County Income & Income Inequality: ACS 2010, ACS 2015 & 5-year change -- U.S. by county/metro - 04/18/17
• State/county 2015 Demographic-Economic Characteristics - 04/03/17
.. 4 sections/files .. General Demographics
.. Social
.. Economic
.. Housing
•
County Urban Rural Characteristics -- U.S. by county/metro - 03/27/17
•
Local Area Economic Situation -- monthly employment by U.S. county/metro - 03/24/17
• City/Place 2015 Demographic-Economic Characteristics - U.S. by city/place - 03/23/17
.. 4 sections/files .. General Demographics
.. Social
.. Economic
.. Housing
•
Economic Prosperity by ZIP Code Area -- updates; U.S. by ZIP Code; keyed to city - 03/18/17
•
Health Insurance Coverage by Demographic Group -- U.S. by county/state - 03/15/17
• Monthly Building Permits -- cities, counties, metros - 03/08/17
• Jobs-to-Housing Ratio; Employment & Housing+ -- cities, counties, metros - 03/01/17
• U.S. National Scope K-12 Schools -- individual school attributes - 02/15/17
• Housing Value Appreciation/HPI by ZIP Code 2015Q3-2016Q3 - 02/06/17
• School Districts 2015 Demographic-Economic Characteristics - 01/25/17
.. 4 sections/files .. General Demographics
.. Social
.. Economic
.. Housing
• Consumer Expenditure Patterns by type of product/service; U.S., regions, metros - 01/16/17
• Housing Price Index Quarterly Update: 2015Q3-2016Q3; Metro, State - 01/14/17
• Urban Area Demographic Trends 2010-15 & Urban Areas in Context of Metropolitan Areas - 01/09/17
• State Population & Components of Change Estimates: 2010-2016 - new 2016 data - 12/22/16
• School District Demographic Trends; 2010-2015 - each/all districts; 2015 updates - 12/19/16
• Economic Prosperity by ZIP Code Area - ACS 2015 updates - 12/14/16
• Health Characteristics by City & Census Tract - 12/10/16
• 2016 Presidential Vote & Citizen Voting Age Population - U.S. by county - 12/06/16
• Regional Economic Information System - county-state; time series; annual update - 11/18/16
• Local Areas Economic Situation - county/metro; monthly update; over the year change - 10/31/16
• State Diversity Patterns 2015 - updated Diversity Index - 10/22/16
• World by Country Population Projections to 2050 - 2016 updates - 10/10/16
• Congressional Districts 2015 Demographic-Economic Characteristics - 09/30/16 -
download item D2015DP14
.. 4 sections/files .. General Demographics
.. Social
.. Economic
.. Housing
• Enrollment Characteristics of Largest School Districts - 09/20/16
• State by State, Metro by Metro: What Does $100 Buy - 08/25/16
• Establishments, Employment, Wages 2015Q4 & Over-the Year by Metro - 08/20/16
• 2016 Digital Map Database Road Coverage by County - 08/15/16
• ACS 2014 Children's Demographics by School District - 8/10/16
• ACS 2014 1-year "Supplemental" Estimates -- multi-geography - 7/26/16
• Regional Price Parities by State & Metro: 2008-2014; Metro, State - 7/9/16
• Housing Price Index: 2010-2015 ; annual by 5-digit ZIP code - 7/5/16
• Population by Age, Gender & Race/Origin; U.S. & State; Annual 2010-2015 - 6/27/16
• Real Gross Domestic Product by State & Area; Annual 2000-2015 - 6/23/16
• School District Sources and Uses of Funds; FY2014 - 6/10/16
• New County Residential Construction Authorized; 2014-2015 - 6/6/16
• U.S. County-to-CBSA - xls (05/26/16)
.. downloadable relationship file; see about access.
• City/Places ACS 2014 5-year demographic-economic tables; all U.S. - 05/24/16
- General Demographics ... Social Characteristics
- Economic Characteristics ... Housing Characteristics
• City/Place Population Annual Population Estimates; 2010-2016 - 5/27/17
• Local Area Employment Situation; monthly series updates; metros - 5/17/16
• Tract-City/Place-County Relationship Table - 5/16/16
• Combined Statistical Area Demographic Trends 2010-2015 - 5/10/16
• Texas School Districts; Annual Enrollment 2011-2015 - 4/29/16
• County Business Patterns - establishments & characteristics by 6-digit NAICS - 4/22/16
• Community Health Centers - demographics & operational characteristics - 4/20/16
• Retail Trade Sales by ZIP Code - retail establishments by sales - 4/18/16
• State of the States - how and why state population is changing - 4/7/16
• County Population Trends: 2010-15 - how and why county population is changing - 3/28/16
• Low and Moderate Income Demographics by Block Group - 3/8/16
• Analyzing County Group Quarters Population by type & age - 2/22/16
• Local Education Agencies by Type & State - 2014-15 school year- 2/11/16
• Citizen Voting Age Population by Congressional District - 2/4/16
• ZIP Code to 114th Congressional District Equivalence Table - 2/3/16
• State Legislative Districts: ACS 2014 5-year demographic-economic tables; all U.S. - 01/28/16
- General Demographics ... Social Characteristics
- Economic Characteristics ... Housing Characteristics
• Business Establishment Characteristics by ZIP Code - 1/19/16
• School Districts: ACS 2014 5-year demographic-economic tables; all U.S. - 01/02/16
- General Demographics ... Social Characteristics
- Economic Characteristics ... Housing Characteristics
• Census Tracts; ACS 2014 5-year estimates demographic-economic tables; all U.S. - 12/30/15
- General Demographics ... Social Characteristics
- Economic Characteristics ... Housing Characteristics
• State Population & Personal Income: 2010-2015 - 12/26/15
• Metro New Residential Construction; Nov 2015 monthly data added - 12/23/15
• Metro Gross Domestic Product; current & real; annual series - 12/21/15
• Establishments-Employment-Earnings by sector -- 2015Q2 update - 12/18/15
• 2014 ZIP Code 5-year estimates demographic-economic tables - 12/09/15
- General Demographics ... Social Characteristics
- Economic Characteristics ... Housing Characteristics
• Low & Moderate Income by Census Tract; all tracts by income level - 11/27/15
• Housing Units Annual 2010-2014 & Change: County, Metro, State - 11/25/15
• Rental Market Conditions by State & Metro - 11/23/15
• Relating Block Groups to ZIP Code Areas - 11/19/15
• U.S.-State-Metro 2014 demographic-economic tables - 11/16/15
- General Demographics ... Social Characteristics
- Economic Characteristics ... Housing Characteristics
• Citizen Voting Age Population Characteristics - county, state, US - 11/13/15
• Characteristics of Voters in 2014 Elections - state, US - 11/12/15
• Establishments-Employment-Earnings by sector
- county, metro, state - 2015Q1 update - 11/11/15
• 114th Congressional Districts; 2014 demographic-economic tables - 11/09/15
- General Demographics ... Social Characteristics
- Economic Characteristics ... Housing Characteristics
• ZIP Code demographics by city/place with associated GIS project - 10/29/15
• School Districts Enrollment by Grade+ updates
• ACS 2018 estimates - September
Use your iPad with Interactive Ranking Tables ▲
... use the ranking tables in this section with your iPad
... iPad/iPhone and all major browsers:
Internet Explorer, Firefox, Safari, Opera & Chrome on Windows, Mac OS X & Linux
Using the Multi-Row Selection Feature ▲
This feature enables selection of multiple rows in a grid and then optional copy-to-clipboard and paste-to-application
such as Excel.
The Multi-Row Selection feature is illustrated in the Establishments-Employment-Earnings section.
This feature is being added to selected more recent tables but not yet generally available.
The feature is available for all tables included in the Extended Data Access service.
Extended Data Access Available ▲
Most interactive tables listed in this section do not provide for download.
Many tables are available that are not listed in this section.
Full download access to selected or all tables is available on a fee basis.
For more information use this form to contact us or call (888-364-7656).
Demographic-Economic Estimates and Projections
• Outlook 2020 |
Outlook 2030 |
Outlook 2060 |
Quarterly 3 year
• integrated multi-sourced Situation & Outlook demographic-economic data
Navigating the Federal Statistical System ▲
• http://proximityone.com/fss.htm
-- accessing the vast array of diverse data resources
Location-Based Demographic-Economic Characteristics
... enter an address to find demographic-economic data for associated census tract, city & other geography
... returns latitude-longitude, census block code, census tract code and other geographic data
... see http://proximityone.com/location_based_demographics.htm
Relationship Files ▲
... unlike most references on this page, these are downloadable files.
... these files are in the UserGroup Area & require a
no-fee userid - get here
... terms of use ... these files are not intended for redistribution; there are no warranties.
• U.S. County-to-CBSA (xls)
... structure/content
(05/26/16)
U.S. National Roads Infrastructure ▲
• 2016 Digital Map Database Road Coverage by County - 08/15/16
• TIGER 2014 Road Coverage by County - 08/15/14
• TIGER 2013 Road Coverage by County - 09/09/13
Public Use Microdata Areas & Geographic-Demographic-Economic Tables ▲
• Public Use Microdata Areas (PUMAs) 2010 vintage -- population & component geography (10/28/13)
• ACS 2012 PUMA Demographic-Economic summary data (11/04/13):
General Demographics ..
Social Characteristics ..
Economic Characteristics ..
Housing Characteristics
U.S. National Level & Business/Business Establishments ▲
•
Business Data Information System -- quarterly financial time series -- Individual business SEC filers - 05/24/17
• Healthcare Establishments by ZIP Code by Type of Business - 02/09/18
• Population Projections to 2060
... annual estimates & projections; single year of age and selected age groups
• Retail Trade Sales by ZIP Code - retail establishments by sales - 4/18/16
• Establishments by ZIP Code (09/05/13)
• Business Establishments by Employment Size Class and Sector (11/08/11)
Urban-Rural ▲
• Urban Area Demographic Trends 2010-15 & Urban Areas in Context of Metropolitan Areas - 01/09/17
• ZIP Code Urban/Rural Geography & Demographics - 12/20/16
• ACS 2014 1-year "Supplemental" Estimates urban areas - 7/26/16
• Census 2010 Urbanized Areas: ACS 2012 Demographic-Economic Patterns (9/23/13)
• Urban-Rural Characteristics of 113th Congressional Districts (01/28/13)
• Urban-Rural Population by State & Congressional District (08/17/11)
• Urban Population Patterns 2000-2009 (10/11/10)
Elections & Voting ▲
• 2016 presidential vote & citizen voting age population U.S. by county - 12/06/16
• Citizen Voting Age Population by Congressional District - 2/4/16
• Citizen Voting Age Population Characteristics - 11/13/15
• Characteristics of Voters in 2014 Elections - 11/12/15
• 2012 Presidential/Senatorial/Congressional Elections -- vote by candidate/party(09/20/13)
Health & Healthcare .. goto top
• Texas Health Region Demographics with extended profiles -- 6/29/17
•
Health Insurance Coverage by Demographic Group -- U.S. by county/state - 03/15/17
• Health Characteristics by City & Census Tract - 12/10/16
• Community Health Centers - demographics & operational characteristics - 4/20/16
• Healthcare Sector Establishments by ZIP Code (09/05/13)
Banking & Finance .. goto top
• FDIC Insured Bank by Location - 07/05/19
.. 88,000 banking locations and related institution 2018 deposit & asset characteristics.
Census Blocks ▲
• Create census block datasets using the Demographic-Economic Data Extraction API tool
Block Groups ▲
• Low and Moderate Income Demographics by Block Group - 3/8/16
• Relating Block Groups to ZIP Code Areas; Block Group Population & Area - 11/19/15
• Block Group - ZIP Codes Equivalence Table and Labor Force Characteristics
• Create block group datasets using the Demographic-Economic Data Extraction API tool
ZIP Codes .. goto top
Census Tracts -- scroll section .. goto top .. goto updates list
City/Place Tables -- scroll section .. goto top .. goto updates list
Congressional & State Legislative District Tables -- scroll section .. goto top
County Tables .. goto top
• Population Estimates & Projections to 2060
• Housing Units by County U.S. by County tiem series through 2019 - 11/02/20
• County Business Patterns U.S. by County by Industry - 05/18/20
• Population & Components of Change 2010-2019 Annual U.S. by county - 05/10/20
• Quarterly Census of Employment & Wages 2019Q3 U.S. by county - 04/28/20
• Seniors Characteristics by County 65+, 75+, 85+ - 04/06/20
• U.S. by County COVID-19 Cases - updated daily
.. cases, deaths time series
• U.S. by County New Authorized Residential Construction - 09/09/19
.. annual data 2015-2018; single family/multifamily; units, building, value.
• U.S. by County Monthly Labor Force Situation - 09/07/19
.. new data July 2018; monthly over year July 2017-June 2018
• NonEmployer Business Establishments & Receipts U.S. by county by type of business - 07/08/19
.. non-employer business establishments by industry with up to 5-digit NAICS code.
• Business Establishments, Employment, Wages U.S. by county by type of business - 07/01/19
.. 2018 business establishments by industry with up to 6-digit NAICS code.
• Housing Units 2010-2018 new 2018 updates; U.S, State, County - 06/01/19
..
• Population & Components of Change: 2010-2018 U.S. by County - 04/27/19
.. How & Why State/County Demographics are Changing: Wichita, KS MSA example
• County Gross Domestic Product - 01/05/19
.. annual estimates by sector; per capita, current and real GDP
• County-to-County Migration - 01/02/19
.. 3,142 x 3,142 county matrix origin-destination domestic migration
• U.S. & County Economic Characteristics and Trends .. on 31 economic measures - 11/20/18
.. examine change .. view composites for individual counties; 2010-2017; new 2017 estimates
• Housing Units Time Series: 2010-2017; annual update; U.S, State, Metro - 05/28/18
• County Business Patterns 2016 - establishment characteristics by 6-digit NAICS - 4/25/18
• ACS 2016 Citizen Voting Age Population -- U.S., States & Counties - 02/28/18
•
Change in Life Expectancy by County/Metro -- 1980-2014 -- U.S. by county/metro - 05/10/17
•
Income & Income Inequality: ACS 2010, ACS 2015 & 5-year change -- U.S. by county/metro - 04/18/17
• U.S. by County 2015 Demographic-Economic Characteristics - 04/03/17
.. 4 sections/files .. General Demographics
.. Social
.. Economic
.. Housing
•
Urban Rural Characteristics -- U.S. by county/metro - 03/27/17
•
Local Area Economic Situation -- monthly employment by county/metro - 03/24/17
•
Health Insurance Coverage by Demographic Group -- U.S. by county/state - 03/15/17
• Monthly Building Permits -- cities, counties, metros - 03/08/17
• Jobs-to-Housing Ratio; Employment & Housing+ -- cities, counties, metros - 03/01/17
• 2016 Presidential Vote & Citizen Voting Age Population - U.S. by county - 12/06/16
• Regional Economic Information System - county-state; time series; annual update - 11/18/16
• Local Areas Economic Situation - county/metro; monthly update; over the year change - 10/31/16
• ACS 2014 1-year "Supplemental" Estimates counties/other areas - 7/26/16
• New County Residential Construction Authorized; 2014-2015 - 6/6/16
• County Business Patterns - establishments & characteristics by 6-digit NAICS - 4/22/16
• State of the States - how and why state population is changing (by county) - 4/7/16
• County Population Trends: 2010-15 - how and why county population is changing - 3/28/16
• Analyzing County Group Quarters Population by type & age - 2/22/16
• Establishments-Employment-Earnings by sector -- 2015Q2 update - 12/18/15
• Housing Units Annual Post-Census 2010 Trends - 11/25/15
• Citizen Voting Age Population Characteristics - 11/13/15
• Establishments-Employment-Earnings by high level sector (11/11/15)
• County Population & Components of Change (7/14/15)
• Hispanic Population by Specific Origin Subgroup (10/20/13)
• TIGER 2013 Road Coverage by County (09/09/13)
• County to County Migration (7/14/13)
• County Population by 5-year age cohort: 2010, 2011, 2012 (6/25/13)
• County Daytime Population; ACS 2010 Updates (5/31/13)
• ACS 2011 General Demographics State, Metros, Counties (12/20/12)
• ACS 2011 Social Characteristics State, Metros, Counties (12/20/12)
• ACS 2011 Economic Characteristics State, Metros, Counties (12/20/12)
• ACS 2011 Housing Characteristics State, Metros, Counties (12/20/12)
• Demographic Profile 1 Items, Iterated by Race Group (11/5/12)
• State & Regional Demographic-Economic Sections (10/15/12)
-- state by state sections include 2000-2010 intercensal population estimates ranking table
• All U.S. Public Schools: school-level characteristics query/rank by county (10/17/12)
• ACS 2011 Demographic-Economic Estimates (10/08/12)
• ACS 2010 Demographics for Census 2010 Census Tracts - organized by county (12/15/11)
• Compare Census 2010 Demographics with ACS 2010 1-Year Estimates (11/29/11)
• Measuring & Analyzing the U.S. Voting Population (090711)
• Analyzing Hispanic Demographics (May 2011)
• U.S. by County Monthly Employment-Unemployment Characteristics (Apr 2011 updated monthly)
• U.S. by County Per Capita Personal Income (Apr 2011)
• U.S. by County Census 2000-2010 Population & Housing Units (Mar 2011)
• U.S. by County Census 2010 P.L. 94-171 Demographics (Feb 2011)
• State/County ACS 2009 5-Year Demographic Estimates (12/16/10)
• Multi-area Educational Attainment (2/1/10)
• U.S. by County Race/Ethnicity Diversity 2000, 2008 population (5/26/09)
• U.S. by county: 2000-2008 population estimates and change (3/20/09)
• County Income and Poverty (12/15/08)
• U.S. by county health insurance coverage (10/10/08)
• School age (ages 5-17) population change 2000-2007 (9/11/08)
• U.S. by county: 2000-2007 housing unit estimates and change (8/21/08)
• School age (ages 5-17) population change 2000-2006
• American Indian Population (Census 2000)
Metropolitan Areas .. goto top
• Population Estimates & Projections to 2060
• Metro Demographic-Economic Characteristics -- 2019 annual update - 09/29/20
.. 4 sections/files .. General Demographics
.. Social
.. Economic
.. Housing
• Metro Population & Components of Change
annual 2010-2019 -- 09/22/20
• Metro Gross Domestic Product - 02/05/20
.. 2010-2018 annual time series
• U.S. by CBSA/Metro & County Components - 09/05/19
.. Sep 2018 vintage CBSAs (current); population & components of change; annual 2010-2018
• Housing Price Index Quarterly Update: 2018Q1-2019Q1; U.S, State, Metro - 06/03/19
..
• Metro Real Personal Income/Related Measures - 2008-2017 annual - 05/20/19
• Metro Population & Components of Change: 2010-2018 - 05/06/19
.. View Metro S & O Reports via links in this table
• Metropolitan Statistical Areas
2017 Demographic-Economic Characteristics - 01/15/19
.. 4 sections/files .. General Demographics
.. Social
.. Economic
.. Housing
• Housing Price Index Quarterly Update: 2017Q3-2018Q3; U.S, State, Metro - 12/31/18
• Housing Units Time Series: 2010-2017; annual update; U.S, State, Metro - 05/28/18
• Housing Price Index; 2010-2017 U.S., State, Metro - 03/02/18
• Metro 2016 Demographic-Economic Characteristics - 01/18/18
.. 4 sections/files .. General Demographics
.. Social
.. Economic
.. Housing
• GDP by Industry -- U.S. state, MSAs -- 8/05/17
• Metro Population & Components of Change Estimates; 2010-2016 - 6/21/17
.. access to table requires User Group ID.
Join now. No fee.
•
Change in Life Expectancy by County/Metro -- 1980-2014 -- U.S. by county/metro - 05/10/17
•
Income & Income Inequality: ACS 2010, ACS 2015 & 5-year change -- U.S. by county/metro - 04/18/17
•
Urban Rural Characteristics -- U.S. by county/metro - 03/27/17
•
Local Area Economic Situation -- monthly employment by county/metro - 03/24/17
• Monthly Building Permits -- cities, counties, metros - 03/08/17
• Jobs-to-Housing Ratio; Employment & Housing+ -- cities, counties, metros - 03/01/17
• Consumer Expenditure Patterns by type of product/service; U.S., regions, metros - 01/16/17
• Housing Price Index Quarterly Update: 2015Q3-2016Q3; Metro, State - 01/14/17
• Local Areas Economic Situation - county/metro; monthly update; over the year change - 10/31/16
• Establishments, Employment, Wages 2015Q4 & Over-the Year by Metro - 08/20/16
.. with quarterly CSV downloads, 2013 forward, establishments, employment & Wages by 6-digit NAICS
• Metro by Metro: What Does $100 Buy - 08/25/16
.. annual buying power index, 2008-14 by type of goods & services • ACS 2014 1-year "Supplemental" Estimates metros/other areas - 7/26/16
• ACS 2014 1-year "Supplemental" Estimates metros/other areas - 7/26/16
• Regional Price Parities by Metro: 2008-2014 - 7/9/16
• Individual Metro Situation & Outlook Reports - updated continuously
• Local Area Employment Situation; monthly series updates; metros - 5/17/16
• Combined Statistical Area Demographic Trends 2010-2015 - 5/10/16
• Metro New Residential Construction; Nov 2015 monthly data added - 12/23/15
• Metro Gross Domestic Product; current & real; annual series - 12/21/15
• Establishments-Employment-Earnings by sector -- 2015Q2 update - 12/18/15
• Housing Price Index Quarterly Update: 2014Q3-2015Q3 - 11/25/15
• Housing Units Annual Post-Census 2010 Trends - 11/25/15
• Rental Market Conditions by Metro - 11/23/15
• 2014 Demographic-Economic tables - 11/16/15
- General Demographics ... Social Characteristics
- Economic Characteristics ... Housing Characteristics
• Establishments-Employment-Earnings by high level sector (11/11/15)
• Metro Household Income & Household Value: 2013-2014 (10/5/15)
• Housing Price Index 2015Q2 10/2/15 -- updated quarterly
• Metro Population & Components of Change (7/14/15)
• Metro GDP Information & Communications Technology Sector Trends (10/20/13)
• ACS 2012 1 Year Selected Characteristics (9/20/13)
• Metro GDP 2001-2012 -- uses 2013 vintage metros (09/18/13)
• 2013 New Official Metro Designations metro county components & demographic updates (03/07/13)
• ACS 2011 1-year (estimates for 2011) General Demographics (12/20/12)
• ACS 2011 1-year (estimates for 2011) Social Characteristics (12/20/12)
• ACS 2011 1-year (estimates for 2011) Economic Characteristics (12/20/12)
• ACS 2011 1-year (estimates for 2011) Housing Characteristics (12/20/12)
• ACS 2011 5-year (estimates centric to 2009) General Demographics States, Metros, Counties (12/20/12)
• ACS 2011 5-year (estimates centric to 2009) Social Characteristics States, Metros, Counties (12/20/12)
• ACS 2011 5-year (estimates centric to 2009) Economic Characteristics States, Metros, Counties (12/20/12)
• ACS 2011 5-year (estimates centric to 2009) Housing Characteristics States, Metros, Counties (12/20/12)
• ACS 2011 Demographic-Economic Estimates (10/08/12)
• Median Gross Rent Trends: 2008-2011 (10/04/12)
• ACS 2010 Demographics for Census 2010 Census Tracts - organized by metro (12/15/11)
• Compare Census 2010 Demographics with ACS 2010 1-Year Estimates (11/29/11)
• Establishments, Employment, Wages by Metro by Sector new 2011q1 data (101711)
• Metropolitan Area Income & Poverty: 2009-2010 (092911)
• Analyzing Asian Census 2000-2010 Population by Metro (June 2011)
• Analyzing Hispanic Demographics (May 2011)
• Per Capita Personal Income (Apr 2011)
• U.S. by Metro 2000-2010 Population & Housing Units (Mar 2011)
• Disability Status by Age (10/20/10)
• Rental Market Conditions (10/18/10)
• Health Insurance Coverage (10/7/10)
• Median Housing Value by State & Metro: 2007, 2008 & Change (3/1/10)
• Multi-area Educational Attainment (2/1/10)
• Graying of America, Population 65 Years and Over (2/1/10)
• MSA Gross Domestic Product estimates 2000-2008 (9/29/09)
• CBSAs & counties: 2000-2008 population estimates and change (3/20/09)
• School District to Core-Based Statistical Area (MSA/MISA) Equivalence (2/3/09)
• MSA labor force characteristics, 2008Q2 and earlier data (9/2/08)
Selected Population Groups/Geographic Areas -- scroll section ▲
School & School District Tables .. goto top
States -- scroll section .. goto top
• Population Estimates & Projections to 2060
• Population & Components of Change by State - 01/06/20
.. 2010-2019 annual time series
• Population & Components of Change by State - 01/06/20
.. 2010-2019 annual time series
• Personal Consumption Expenditures by Type & State - 10/28/19
.. 2010-2018 annual time series
• U.S. & State Real Median Household Income - 10/17/19
.. 2005-2018 annual time series
• U.S. & State Annual Real GDP by Sector - 08/12/19
.. annual data 2010-2018; 91 sectors; total & per capita; updates twice (preliminary/revised) annually.
• U.S. & State Quarterly Real GDP by Sector - 08/05/19
.. quarterly data 2018q1-2019q1; 24 sectors; total & per capita; updates and extends quaterly.
• Housing Units 2010-2018 new 2018 updates; U.S, State, County - 06/01/19
..
• U.S. & States 2010-2018 Population & Components of Change - 01/07/19
.. 2018 estimates new and start the 2019 demographic estimates cycle
• Housing Price Index Quarterly Update: 2017Q3-2018Q3; U.S, State, Metro - 12/31/18
• U.S. & State Economic Characteristics and Trends .. on 31 economic measures - 11/20/18
.. examine change .. view composites for individual states; 2010-2017; new 2017 estimates
• U.S. & States 2017 Demographic-Economic Characteristics - 10/31/18
.. 4 sections/files .. General Demographics
.. Social
.. Economic
.. Housing
•
2010 & 2020 U.S. House Apportionment by State (and historical apportionments) - 09/20/18
• State-to-State Geographic Mobility. 2010-2017; annual update - 07/30/18
• Housing Units Time Series: 2010-2017; annual update; U.S, State, Metro - 05/28/18
• Housing Price Index; 2010-2017 U.S., State, Metro - 03/02/18
• ACS 2016 Citizen Voting Age Population -- U.S. & States - 02/28/18
• U.S. by State Population & Components of Change; annual 2010-2017 & GIS project -- 12/22/17
• U.S. & State 2016 Demographic-Economic Characteristics - 09/27/17
.. 4 sections/files .. General Demographics
.. Social
.. Economic
.. Housing
.. features GIS tools & ready-to-use project/data
.. integrating state quarterly personal income 2010Q1 through 2017Q2
• GDP by Industry -- U.S. state, MSAs -- 8/05/17
• State Quarterly GDP by Industry -- 8/01/17
• State Net Worth & Related Measures 6/7/17
• U.S. by State 2015 Demographic-Economic Characteristics - 04/03/17
.. 4 sections/files .. General Demographics
.. Social
.. Economic
.. Housing
•
Health Insurance Coverage by Demographic Group -- U.S. by county/state - 03/15/17
• State Population & Components of Change Estimates: 2010-2016 - new 2016 data - 12/22/16
• Regional Economic Information System county-state; time series; annual update - 11/18/16
• State Diversity Patterns 2015 - updated Diversity Index - 10/22/16
• State by State: What Does $100 Buy - 08/25/16
.. annual buying power index, 2008-14 by type of goods & services
• ACS 2014 1-year "Supplemental" Estimates states & other areas - 7/26/16
• Regional Price Parities by State: 2008-2014 - 7/9/16
• Housing Price Index Quarterly Update: 2015Q1-2016Q1 - 7/5/16
• Population by Age, Gender & Race/Origin; U.S. & State; Annual 2010-2015 - 6/27/16
.. with briefing notes/narrative; related subject matter individual state/area profiles
• Real Gross Domestic Product by State & Area; Annual 2000-2015 - 6/23/16
• State of the States - how and why state population is changing - 4/7/16
• Analyzing County Group Quarters Population by type & age -- includes states - 2/22/16
• State Population & Personal Income: 2010-2015 - 12/26/15
• Establishments-Employment-Earnings by sector -- 2015Q2 update - 12/18/15
• Housing Price Index Quarterly Update: 2014Q3-2015Q3 - 11/25/15
• Housing Units Annual Post-Census 2010 Trends - 11/25/15
• Rental Market Conditions by State - 11/23/15
• 2014 Demographic-Economic tables - 11/16/15
- General Demographics ... Social Characteristics
- Economic Characteristics ... Housing Characteristics
• Citizen Voting Age Population Characteristics - 11/13/15
• Characteristics of Voters in 2014 Elections - 11/12/15
• Establishments-Employment-Earnings by high level sector - 11/11/15
• State Population & Components of Change (7/14/15)
• Real Median Household Income 2000-2012 & Change (10/23/13)
• State Annual Population Components of Change (7/2/13)
• State Daytime Population; ACS 2010 Updates (5/31/13)
• ACS 2011 1-year (estimates for 2011) General Demographics (12/20/12)
• ACS 2011 1-year (estimates for 2011) Social Characteristics (12/20/12)
• ACS 2011 1-year (estimates for 2011) Economic Characteristics (12/20/12)
• ACS 2011 1-year (estimates for 2011) Housing Characteristics (12/20/12)
• ACS 2011 5-year (estimates centric to 2009) General Demographics States, Metros, Counties (12/20/12)
• ACS 2011 5-year (estimates centric to 2009) Social Characteristics States, Metros, Counties (12/20/12)
• ACS 2011 5-year (estimates centric to 2009) Economic Characteristics States, Metros, Counties (12/20/12)
• ACS 2011 5-year (estimates centric to 2009) Housing Characteristics States, Metros, Counties (12/20/12)
• Demographic Profile 1 Items, Iterated by Race Group (11/5/12)
• Demographic-Economic Statistical System - online data access; related to ranking tables
• School Enrollment by State by Age and Type of Enrollment (10/16/12)
• State Monthly Employment and Unemployment Trends (10/11/12)
• ACS 2011 Demographic-Economic Estimates (10/08/12)
•
Median Household Income Change; 2010-2011 & Gini Indexes (09/23/12)
• Compare Census 2010 Demographics with ACS 2010 1-Year Estimates (11/29/11)
• State to State Migration in 2010 (11/16/11)
• State & Metro Income & Poverty: 2009-2010 (092911)
• State Median Household Income Patterns: 1990-2010 (092311)
• State Educational Attainment Patterns: 1990-2010 (092211)
• Measuring & Analyzing the U.S. Voting Population (09/07/11)
• Urban-Rural Population by State & Congressional District (08/17/11)
• Census 2000, Census 2010 & Change: Age & Gender (June 2011)
• State to State Migration in 2009 (May 2011)
• Analyzing Hispanic Demographics (May 2011)
• Current Employment/Unemployment; Alternative Unemployment Measures (Apr 2011 updated monthly)
• State Population Trends (Apr 2011)
• U.S. by State Quarterly Personal Income (Apr 2011)
• Per Capita Personal Income (Apr 2011)
• U.S. by State Census 2000-2010 Population & Housing Units (Mar 2011)
• U.S. by State Census 2010 P.L. 94-171 Demographics (Feb 2011)
• Census 2010 Population and Congressional Seats (12/21/10)
• State/County ACS 2009 5-Year Demographic Estimates (12/16/10)
• Median Housing Value by State & Metro: 2007, 2008 & Change (3/1/10)
• State Voting & Registration Patterns (2/15/10)
• Multi-area Educational Attainment (2/1/10)
• Charter School Demographics & Patterns (2/15/10)
• Births by State (2/23/10)
• Foreign-Born Population by Region of Birth by State (2/1/10)
• K-12 Schools by Type & Enrollment by School Type by State: 2007-08 (10/29/09)
• Population Ages Under 5 Years: 2000-2008 (9/29/09)
• Population Ages 5-to-17 Years: 2000-2008 (9/29/09)
• Population Ages 18-to-34 Years: 2000-2008 (9/29/09)
• Population Ages 65 Years & Over: 2000-2008 (9/29/09)
• Population estimates and projections to 2030; ages 5-17
• Population estimates and projections to 2030; ages 65+
• Population estimates and projections to 2030; Total
World by Country ▲
• World by Country Population Projections to 2050 - 2016 updates - 10/10/16
Terms of Use ▲
There is no warranty of any type associated with any aspect of this Web page nor any page for links on this page.
The user of this document is solely responsible to any use, direct or indirect, that might be made of this document or related pages or data.
Links to this page are encouraged. Use made of these data should reference ProximityOne and include the URL (http://proximityone.com/rankingtables.htm).
Contact us (888.364.7656) for more information.
Support Using these Resources ▲
Learn more about demographic economic data and related analytical tools.
Join us in a Data Analytics Lab session.
There is no fee for these Web sessions.
Each informal session is focused on a specific topic.
The open structure also provides for Q&A and discussion of application issues of interest to participants.
ProximityOne User Group ▲
Join the ProximityOne User Group
to keep up-to-date with new developments relating to geographic-demographic-economic decision-making information resources.
Receive updates and access to tools and resources available only to members.
Use this form to join the User Group.
Additional Information ▲
ProximityOne develops geographic-demographic-economic data and analytical tools and helps organizations knit together and use diverse data in a decision-making and analytical framework. We develop custom demographic/economic estimates and projections, develop geographic and geocoded address files, and assist with impact and geospatial analyses.
Wide-ranging organizations use our software, data and methodologies to analyze their own data integrated with other data.
Follow ProximityOne on Twitter at
www.twitter.com/proximityone.
Contact ProximityOne (888-364-7656) with questions about data covered in this section or to discuss custom estimates, projections or analyses for your areas of interest.
|