
|
|
School District Demographic Economic Characteristics -- ACS 2015 Household Composition, Education, Language, Related Attributes
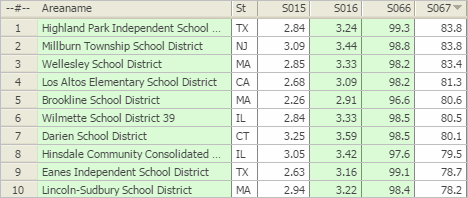
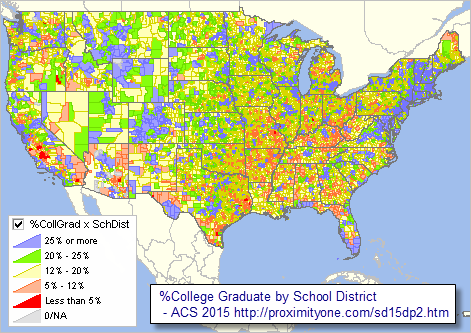
Percent college graduates is one measure useful to characterize educational attainment and social characteristics for a school district. How do school districts of interest compare to peers or in a region? There are other measures that need to be considered for a more comprehensive look at social characteristics. This section is focused on tools, resources and methods that you can use to access, integrate and analyze school district social characteristics. These data uniquely provide insights into many of the most important social characteristics. This section updates in 2018. One of Four Sections. Approximately 600 subject matter items from the American Community Survey ACS 2015 database are included in these four pages/tables: • General Demographics • Social Characteristics -- this page/section -- view table • Economic Characteristics • Housing Characteristics School Districts with Highest Percent College Graduates Use the interactive table below in this section to examine social housing characteristics of school districts. Below is a list of the 10 school districts having the highest percent college graduates developed using the interactive tables.  - ranked on item S067 -- percent population ages 25 years and over who are college graduates. Patterns of Educational Attainment by School District - percent college graduate (item S067 in table)  - view developed with CVGIS software using related GIS project and datasets. Related Sections See related tables for Census Tracts | ZIP Codes | State, Metro & County. Using the Interactive Table Use the interactive table below to view, query, rank, compare social characteristics of the population for these areas. The scroll box shown below lists each of the subject matter items available for each area via the ranking table. In the subject matter items scrollbox, subject matter items are organized into to mini-tables with related items. The number at the left of the subject matter item is also used as the short name for the subject matter item in the column header in the ranking table. Affiliate Geography. This page introduces use of the Affiliate Geography. The rightmost column (Geo2) may contain a school district code for an affiliated school district. In this table, the affiliated code is only active for Phoenix Union High School District, AZ and affiliated, intersecting in this case, 13 elementary school districts. Click ShowAll button and then the Affiliate button below the table. The table refreshes showing only these districts. Now this set of districts may be sorted and viewed as a group. Affiliated geography coding is useful to examine related elementary/secondary districts (that overlap the same geography). Social Characteristics Items .. a few item names and numbers changed from previous year data/table.
HOUSEHOLDS BY TYPE
S001 Total households S002 Family households (families) S003 With own children of the householder under 18 years S004 Married-couple family S005 With own children of the householder under 18 years S006 Male householder, no wife present, family S007 With own children of the householder under 18 years S008 Female householder, no husband present, family S009 With own children of the householder under 18 years S010 Nonfamily households S011 Householder living alone S012 65 years and over S013 Households with one or more people under 18 years S014 Households with one or more people 65 years and over S015 Average household size S016 Average family size RELATIONSHIP S017 Population in households S018 Householder S019 Spouse S020 Child S021 Other relatives S022 Nonrelatives S023 Unmarried partner MARITAL STATUS S024 Males 15 years and over S025 Never married S026 Now married, except separated S027 Separated S028 Widowed S029 Divorced S030 Females 15 years and over S031 Never married S032 Now married, except separated S033 Separated S034 Widowed S035 Divorced FERTILITY S036 Number of women 15 to 50 years old who had a birth in the past 12 months S037 Unmarried women (widowed, divorced, and never married) S038 Per 1,000 unmarried women S039 Per 1,000 women 15 to 50 years old S040 Per 1,000 women 15 to 19 years old S041 Per 1,000 women 20 to 34 years old S042 Per 1,000 women 35 to 50 years old GRANDPARENTS S043 Number of grandparents living with own grandchildren under 18 years S044 Grandparents responsible for grandchildren Years responsible for grandchildren S045 Less than 1 year S046 1 or 2 years S047 3 or 4 years S048 5 or more years S049 Number of grandparents responsible for own grandchildren under 18 years S050 Who are female S051 Who are married SCHOOL ENROLLMENT S052 Population 3 years and over enrolled in school S053 Nursery school, preschool S054 Kindergarten S055 Elementary school (grades 1-8) S056 High school (grades 9-12) S057 College or graduate school EDUCATIONAL ATTAINMENT S058 Population 25 years and over S059 Less than 9th grade S060 9th to 12th grade, no diploma S061 High school graduate (includes equivalency) S062 Some college, no degree S063 Associate's degree S064 Bachelor's degree S065 Graduate or professional degree S066 Percent high school graduate or higher S067 Percent bachelor's degree or higher VETERAN STATUS S068 Civilian population 18 years and over S069 Civilian veterans DISABILITY STATUS OF THE CIVILIAN NONINSTITUTIONALIZED POPULATION S070 Total Civilian Noninstitutionalized Population S071 With a disability S072 Under 18 years S073 With a disability S074 18 to 64 years S075 With a disability S076 65 years and over S077 With a disability RESIDENCE 1 YEAR AGO S078 Population 1 year and over S079 Same house S080 Different house in the U.S. S081 Same county S082 Different county S083 Same state S084 Different state S085 Abroad PLACE OF BIRTH S086 Total population S087 Native S088 Born in United States S089 State of residence S090 Different state S091 Born in Puerto Rico, U.S. Island areas, or born abroad to American parent(s) S092 Foreign born U.S. CITIZENSHIP STATUS S093 Foreign-born population S094 Naturalized U.S. citizen S095 Not a U.S. citizen YEAR OF ENTRY S096 Population born outside the United States S097 Native S098 Entered 2010 or later S099 Entered before 2010 S100 Foreign born S101 Entered 2010 or later S102 Entered before 2010 WORLD REGION OF BIRTH OF FOREIGN BORN S103 Foreign-born population, excluding population born at sea S104 Europe S105 Asia S106 Africa S107 Oceania S108 Latin America S109 Northern America LANGUAGE SPOKEN AT HOME S110 Population 5 years and over S111 English only S112 Language other than English S113 Speak English less than "very well" S114 Spanish S115 Speak English less than "very well" S116 Other Indo-European languages S117 Speak English less than "very well" S118 Asian and Pacific Islander languages S119 Speak English less than "very well" S120 Other languages S121 Speak English less than "very well" ANCESTRY S122 Total population S123 American S124 Arab S125 Czech S126 Danish S127 Dutch S128 English S129 French (except Basque) S130 French Canadian S131 German S132 Greek S133 Hungarian S134 Irish S135 Italian S136 Lithuanian S137 Norwegian S138 Polish S139 Portuguese S140 Russian S141 Scotch-Irish S142 Scottish S143 Slovak S144 Subsaharan African S145 Swedish S146 Swiss S147 Ukrainian S148 Welsh S149 West Indian (excluding Hispanic origin groups) COMPUTERS AND INTERNET USE S150 Total households S151 With a computer S152 With a broadband Internet subscription School District Social Characteristics -- interactive table ACS 2015 5-year estimates Click ShowAll button between Find/Queries. Use mouseover on column header to view column description. See usage notes below table. See related tables -- http://proximityone.com/rankingtables.htm. Usage Notes • If table not showing any rows; click ShowAll button below table. • Use vertical and horizontal scroll bars to navigate up/down or left/right. • Adjust column widths using column divider between header cells. • CBSA> button -- use to select districts in a specified metro/CBSA .. get metro 5-character code here .. paste the 5-character metro code in the edit box to right of CBSA> button. .. overwriting the value 19100. .. click the CBSA> button ... table refreshes with all districts in specified metro. • Find Name> button -- use to select district based on exact spelling of partial name in column 1. .. Key in exact up/low case spelling of partial name of district in the edit box to right of Find Name> button. .. overwriting the value Dallas. .. click the Find Name> button ... table refreshes with all districts with matched spelling in column 1. • Selected columns -- "AvgHHSize.AvgFamSize.%HSGrad.%CollGrad" below the table to show only these columns; .. click "All columns" button to restore view to all columns. • All items are estimates for 2015. • Click ShowAll button between specific area queries. • Cells with negative value could not be estimated (for this geography and this time frame). Selecting Districts within a Metro/CBSA Proceed with these steps to view districts within a selected metro/CBSA: • Click ShowAll button below table. • Click AvgHHSize.. button below table. • Click the CBSA> button (using the default Dallas metro CBSA code 19100). • Click the S067 column header; click again to sort in other direction. Examine a metro of interest -- get metro 5-character code here .. • Click ShowAll button below table. • Click AvgHHSize.. button below table. • Paste the 5-character metro code in the edit box to right of CBSA> button. .. overwriting the value 19100. • Click the CBSA> button. • Click the S067 column header; click again to sort in other direction. Use find codes/names to determine census tract, city/place, school district etc. geocode/area name based on address. Importance of Demographic-Economic Data The importance of understanding the demographic-economic make-up and trends can hardly be overstated. Community and educational challenges and opportunities are shaped by demographic-economic dynamics. Only by knowing "where we are" can we develop the most effective plans for improvement. The American Community Survey provides "richer" demographic-economic characteristics for national scope wide-ranging geographic areas. While Census 2010 provides data similar to those items in the General Demographics section, only ACS sourced data provide details on topics such as income and poverty, labor force and employment, housing value and costs, educational participation and attainment, language spoken at home, among many related items. The approximate 600 items accessible via the dataset are supplemented by a wide range of additional subject matter. These data are updated annually in December of each year for each/all political/statistical areas, including school districts, census tracts, ZIP code areas and block groups. ProximityOne User Group Join the ProximityOne User Group to keep up-to-date with new developments relating to metros and component geography decision-making information resources. Receive updates and access to tools and resources available only to members. Use this form to join the User Group. Support Using these Resources Learn more about accessing and using demographic-economic data and related analytical tools. Join us in a Data Analytics Lab session. There is no fee for these one-hour Web sessions. Each informal session is focused on a specific topic. The open structure also provides for Q&A and discussion of application issues of interest to participants. Additional Information ProximityOne develops geodemographic-economic data and analytical tools and helps organizations knit together and use diverse data in a decision-making and analytical framework. We develop custom demographic/economic estimates and projections, develop geographic and geocoded address files, and assist with impact and geospatial analyses. Wide-ranging organizations use our tools (software, data, methodologies) to analyze their own data integrated with other data. Follow ProximityOne on Twitter at www.twitter.com/proximityone. Contact us (888-364-7656) with questions about data covered in this section or to discuss custom estimates, projections or analyses for your areas of interest. |
|
|