|
|
|
.. congressional district decision-making information .. interpretative data analytics; tools, data & methods March 2026 .. .. a look ahead .. the U.S. 120th Congress is in session from Jan 3, 2027 to Jan 3, 2029. See the section on the 120th Congressional Districts and related areas reflecting the November 2026 elections and the current situation. .. did you know? .. the 119th congressional districts ranged in percent population change, 2020-2023, from -9.4% (NY06) to 13.8% (TX03) .. the CD with the lowest 2023 median household income ($MHI) was KY05 ($44,175) and the CD with the highest $MHI was CA17 ($175,010). The economic divide continues to expand. Use tools/resources reviewed in this section to view/analyze geographic, demographic, economic characteristics of Congressional Districts. Learn more about congressional district demographic economic characteristics using the interactive table below. What's New • 119th Congressional District Election Results Interactive Table and related demographics • Congressional District ACS 2022 & ACS 2023 Demographic Interactive Table - learn how population, employment and the unemployment rate are changing. • New 119th Congressional District Mapping (5 states have newly configured CD boundaries) - use the iVDA interactive mapping below • Join us in the "every Wednesday" Congressional District GeoDemograpics Web session. - see connectivity & details iVDA GIS Mapping -- Find, Examine, Compare Congressional Districts .. the start-up view is focused on the U.S. 48 continguous states by congressional district. .. iVDA is one part of a broader VDA GIS resource framework. See more about VDA GIS. Option 1 .. click a CD in the map window to view demographic profile • In the legend panel at left of map window, click the layername "CD118". It turns blue. • Click any CD in the map. A demographic profile shows in the panel at lower left. .. this Base project uses the new official 119th CD boundaries and also the 118th CD boundaries Option 2 -- Locate a CD based on an address or location .. key in a location in searchbar and click Location button; the view zooms to that location. - examples: a ZIP code, address or location like Detroit, MI; maybe your own address. - now you see that location showing CDs in context of congressional districts for that location. - navigate as needed to get a preferred view. .. in the legend panel at the left, click on three layers "CD118 Code", "CD118" and "CD118 Bold". .. click in the map to select and view a CD; a profile of that CD appears in the lower left panel. Request a Congressional District/State Legislative District Profile Submit your request here .. enter district in text box .. illustrative Profiles: • Congressional District MI 07 ACS2022 5-year • Congressional District MI 07 ACS2022 1 year • State Legislative District Lower MI 036 ACS2022 5-year • State Legislative District Lower MI 042 ACS2022 5 year Download/Access 118th Congressional District Demographics Use Option 1. Use this API call .. this example .. median household income (ACS2022 1 year) all CDs .. https://api.census.gov/data/2022/acs/acs5?get=NAME,B01001_001E,B19013_001E&for=congressional%20district:* .. click above link; new page opens with 1 row per CD .. population & median household income shown for each CD .. optionally import into spreadsheet .. optionally choose other items .. see list .. join us in web session to discuss further. Option 2. Use DEDE, create GIS friendly files with more options .. see about DEDE .. option 2 supplementary information under development About Congressional Districts The November 2022 elections determined the representatives for the 118th Congressional Districts (CDs) January 2023-December 2024 session. The 118th Congressional District boundaries reflect the redistricting process based on Census 2020 results. Examine 118th U.S. Congressional District American Community Survey demographic-economic characteristics using VDA Web GIS. Join us in the every Wednesday Congressional Districts & Congressional Communities Mapping & Analytics web session. Learn more about accessing and using congressional district demographics, demographic change and Congressional Communities. Topics in this section 01 Updates 02 Interactive Table .. view/compare districts .. updated with 2020 ACS data 03 Gallery 04 Mapping & GIS Tools Step-by-Step CD Analytics Tutorial 05 Census 2020 Comparing Congressional Districts Using Demographic Profile 06 American Community Survey .. annual richer demographics 07 Congressional Communities & Congressional Districts 08 Predicting/Analyzing Policy Effects Gallery .. View/Analyze Congressional Districts .. Make Maps Like These Patterns of %Population Change 2020-2022 by 118th Congressional District  .. click graphic for larger view (desktop with full-screen browser recommended). .. view developed using VDA GIS tools. .. see graphic with number of apportioned seats by state based on Census 2020. Use the VDA GIS resources to examine the 118th CDs in context of other geography and subject matter. Locate a 118th CD based on an address .. see the interactive table below and related notes. 118th Congressional District with Highest Median Household Income .. goto top Created using VDA Web GIS, this view shows a map of the 118th CD with the highest median household income ($MHI item E062) based on data from ACS 2021. The table below the map shows the CD code, population (D001) and $MHI by CD.  Examine Congressional Districts using your Web browser .. goto top Find a Congressional District & view characteristics .. .. Start Open VDA Web GIS (no login) or Full VDA Web GIS .. opens in new page .. set active layer to Congressional Districts (see in upper left dropdown). Option 1 .. using mouse, click any congressional district area in map. .. CD crosshatches .. profile appears in lower left panel. .. optionally click HTML button below profile for better view in new HTML page. .. the active layer is Cong Dist 118 (see in upper left dropdown). Option 2 .. find a district based on an address. .. key in address in search bar above map, then press enter. consider using only ZIP code 85258 .. map refreshes with zoom to address location/CD and shows blue marker. .. click blue marker; CD then highlights and shows profile as above. .. zoom out and click on the "Cong Dist 118 code" layer in legend panel:  More About Examining 118th Congressional Districts using VDA GIS Use the VDA Web GIS to examine the 118th CDs in context of other geography and subject matter. All that is required to use VDA is a Web browser. VDA uses the same core structure as the Windows desktop VDA Desktop. Start VDA: https://vdagis.com Login then select Congressional Districts/SLD project .. map view appears showing states and 118th Congressional Districts in the 48 contiguous states. Basic Operations. Using the Legend Panel to View Different CD Layers There are several CD layers available to view as shown in the legend panel. To view a layer, click a checkbox by the layer name.  .. click graphic for larger view
Application 1. Find a CD118 based on Address; View in Map & View/Use Demographic Profile Key in an address above map window and press Enter; maybe "reagan national airport" (no quotes). .. Map view zooms to that location and shows marker for location .. click marker .. the CD118 shows crosshatched (VA CD 08) .. the demographic profile shows in lower left panel.  .. click graphic for larger view .. optionally click HTML button to view profile in new window: profile in xls structure: click this link to view profile in xls structure Application 2. Patterns of Economic Prosperity by Census Tract in Context of 118th CDs  .. click graphic for larger view Application 3. Compare CDs in Interactive Table .. continuing from Application 1, click right button below map window (Query/Table) .. grid appears below map Click Select Field button below table/grid .. check selected items and close form Table populates with Arizona 118th CDS.  118th Congress .. goto top The 118th Congress runs from January 1, 2023 through December 31, 2024. The 2022 House of Representatives elections occurs on November 8, 2022. Elections will be held to elect representatives from all 435 congressional districts for the 118th Congress. Those elected will serve in the 118th Congress with seats apportioned among the states based on the Census 2020. Using census block level data from Census 2020 each state redistricts their apportioned number seats with new boundaries to be determined mostly in time for the 2022 elections. 118th congressional district basic demographics from Census 2020, retabulated to the 118th boundaries, are available as of 2023. The 118th CD boundaries are provided to the Census Bureau by states and are integrated into the TIGER public use digital map database released in 2023. More detailed 118th congressional district demographic-economic data are available from the ACS 2022 released in 2023.
.. see related Congressional District Analytics section on
business establishment characteristics by congressional district.
Business establishments account for roughly 83 percent of the total employment in the United States.
The number and characteristics of business establishments
vary widely among congressional districts.
Examine the distribution of business establishments by type of business by congressional district in the
related section.
Congressional District Structural Patterns: Houston/Harris County, TX .. goto top  - view developed using ProximityOne CV XE GIS and related GIS project. - counties shown with white boundary. - congressional district code/number shown with yellow label. - republican incumbent shown with red color. - democrat incumbent shown with blue color. - cross-hatch pattern shows CD TX02 and impact of gerrymandering in the Houston area. Selected Congressional District Summary Characteristics .. goto top Based on the ACS 2018 median household income (MHI): • the MHI among all districts was $60,291 • the U.S. overall MHI was $61,937 As of November 2019: • there are 69 Republican incumbent districts above the all districts MHI • there are 149 Democrat incumbent districts above the all districts MHI • the MHI of the 236 Democrat incumbent districts is $66,829 • the MHI of the 199 Republican incumbent districts is $56,505 There is one Independent incumbent district. These data are based on 436 districts (includes D.C. and excludes P.R.). Median household income is only one measure of economic prosperity. This is measure at one point in time and provides no insights into trends. .. follow our recurring reviews on Congressional District demographic, social, economic and housing topics .. updates are posted in the User Group e-mails .. and the Blog. join now; no fee. Today's topic is on the Gini Index and examining patterns of inequality. See more about the Gini Index. An expanded version of this topic is available in a separate section available to User Group participants. Patterns of Income Inequality by 116th Congressional District The following graphic shows patterns of income inequality based on the 2018 Gini Index by 116th Congressional District. Use GIS tools/data to generate similar views for any state and/or drill-down. Click graphic for larger view with more detail. Expand browser window for best quality view.  - view developed using ProximityOne CV XE GIS and related GIS project. The Gini index, a measure of income inequality, varies from 0 to 1, with a 0 indicating perfect equality, where there is equal distribution of income. A Gini index of 1 indicates perfect inequality, where one household has all the income. The ACS 2017 U.S. Gini index estimate was 0.480; the ACS 2018 U.S. Gini index estimate was 0.476. View, rank, compare the Gini Index by congressional district using the interactive table below. Selected Congressional District Updates .. scroll section .. goto top 09.26.23. Congressional District & Congressional Communities Diversity Index • Interactive table 09.25.23. Open VDA Web GIS -- Base project updated • New geography/layers added; subject matter extended • About • Start .. not fee, no login 09.19.23. Congressional District Incumbency Update & Demographic Change 2020-2022 • Interactive table 09.14.23. American Community Survey 2022 Congressional Districts Data Release • ACS 2022 08.31.23. Census 2020 "DHC" Detailed Demographic Data Release • Census 2020 Congressional District "DHC" 02.01.23. New Citizen Voting Age by Race and Ethnicity (CVAP) Data The 2021 American Community Survey ACS 2021 5-Year estimates Citizen Voting Age by Race and Ethnicity (CVAP) Special Tabulation data are available. The CVAP data are used in voting rights analysis and otherwsie and are available for many geographic levels down to block-group. The CVAP data will be ready-to-use without downloading via the VDA Web GIS with the MetroDynamics project. View/analyze CVAP patterns at the tract/block group geographic levels in context of Congressional Communities, Congressional Districts and other geography/subject matter. 01.26.23. 118th CD Demographic Profile Subject Matter ACS 2021 social, economic, housing and demographic statistics for the 118th Congress released. Four data profiles based on the 2021 American Community Survey ACS 2021 1-year estimates available for each/all 435 congressional districts. A database has been by ProximityOne site using the Demographic-Economic Data Explorer .. DEDE .. and integrated into shapefiles for mapping/geospatial analysis via VDA Web GIS. Congressional Districts GIS Project Illustrative Views .. ACS 2021 .. choose from ~600 topics .. click graphic for larger views
01.06.23. 118th CD Shapefiles On January 6, the Census Bureau released official TIGER/Line Shapefile products including the 118th Congressional District boundaries by state and as a national file. The congressional district boundaries are the official boundaries as submitted by Census Bureau state liaisons. Download these shapefiles via this link These shapefiles area ready-to-use without downloading, with integrated incumbency and demographic data, are now accessible using VDA Web GIS with the MetroDynamics project. View any selected CD, state or U.S. in context with wide-ranging other geography and subject matter. 10.03.20 Patterns of Economic Prosperity by Congressional District .. examining business establishment characteristics by type of business 12.09.19 Congressional District Analytics .. examining business establishment characteristics by type of business 11.05.19 Congressional District Analytics .. patterns of economic prosperity 10.31.19 Congressional District Analytics .. examining income distributions & income inequality 09.26.19 2018 American Community Survey (ACS2018) data for 116th Congressional Districts. .. selected items in interactive table below .. building your own datasets 08.26.19 New national scope 116th Congressional Districts shapefile now available. .. A part of the TIGER 2019 release 12.01.18 Relating Census Tracts to Congressional Districts interactive table 10.22.18 115th Congressional Districts 2017 Demographic-Economic Characteristics ...General Demographics .. ... Social .. ... Economic .. ... Housing 09.20.18 2010 & 2020 U.S. House Apportionment by State and historical apportionments 04.03.18 108th Congressional Districts ... Census 2000 census block to 108th Congressional District equivalence file (new) 02.28.18 2016 Citizen Voting Age Population 01.05.18 Census 2020 & Redistricting ... join here 09.22.17 115th Congressional Districts 2016 Demographic-Economic Characteristics ...General Demographics .. ... Social .. ... Economic .. ... Housing 10.07.16. Congressional District Demographic-Economic Interactive Analysis ... examining patterns & characteristics of individual & all districts ... 2015 attributes of 114th Congressional Districts General Demographics | Social Characteristics | Economic Characteristics | Housing Characteristics 02.03.16. ZIP Code to Congressional District Equivalencing ... interactive table relating ZIP code areas to congressional districts http://proximityone.com/zip-cd114.htm 11.07.15. Congressional District Demographic-Economic Interactive Analysis ... examining patterns & characteristics of individual & all districts ... 2014 attributes of 114th Congressional Districts General Demographics | Social Characteristics | Economic Characteristics | Housing Characteristics 09.25.15. Congressional District Median Income & Housing Value: 2013-2014 ... examining patterns & characteristics of individual & all districts ... incumbent, party, median income, median housing value; annual change ... use interactive table -- http://proximityone.com/cd114_2013_2014.htm ... visualizing patterns ... geospatial analysis ... 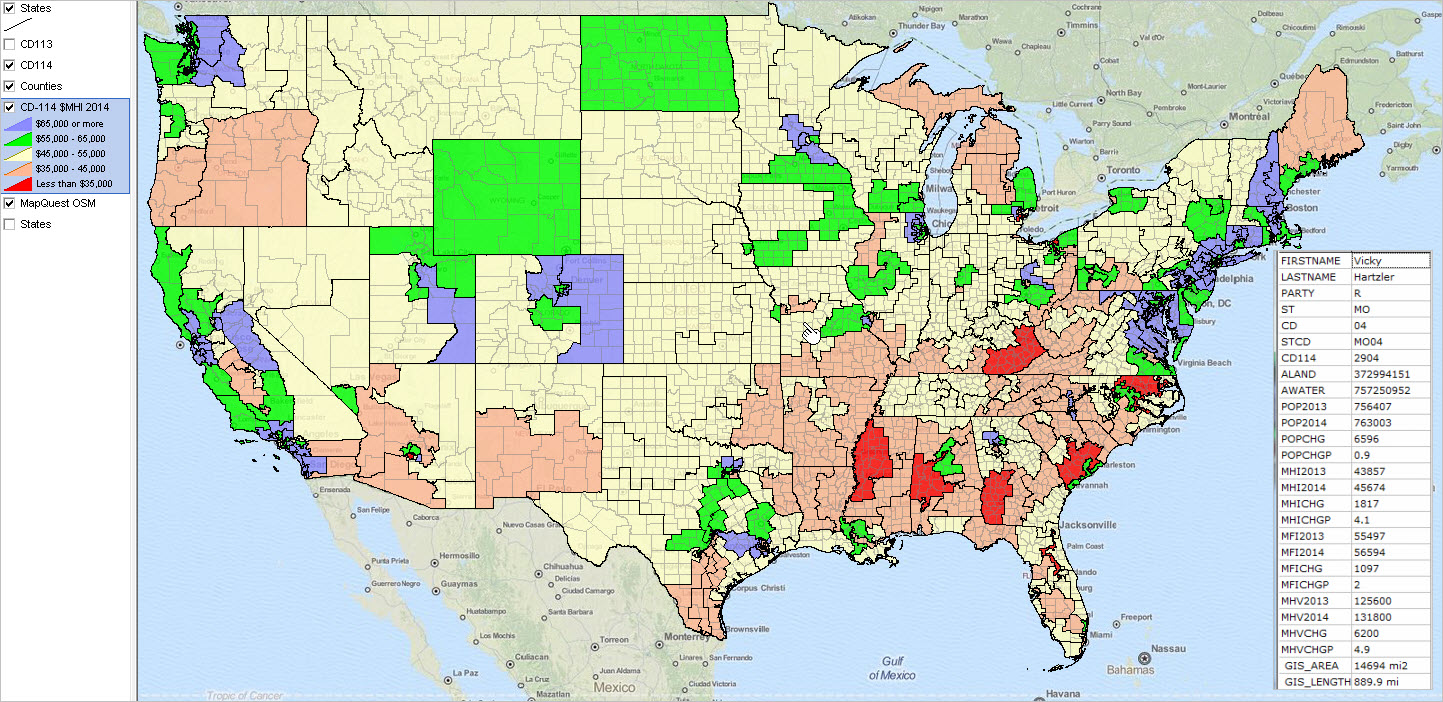 02.14.15. New Voting Rights Act Demographics ... ACS 2009-13 Citizen Voting Age Population (CVAP) estimates by race/origin ... examining relationships between legislative districts, census tracts, voting districts & census blocks ... interactive table -- http://proximityone.com/cvap_tracts_2013.htm ... visualizing patterns ... Los Angeles area ... ... 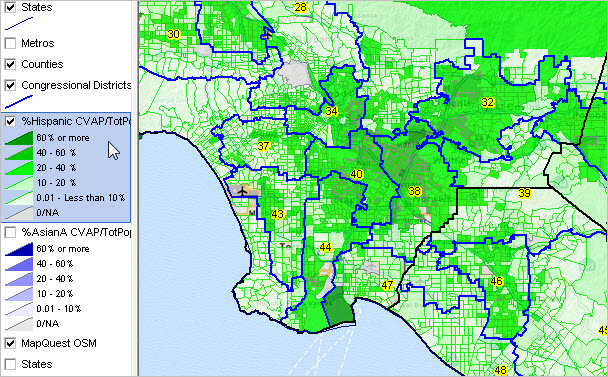 09.29.14. A Century of County Population Change: 1910 to 2010 ... decade to decade population change ... interactive table -- http://proximityone.com/ctypopchg.htm ... visualizing patterns ... Dallas metro region ...  09.18.14. 2013 Congressional District Demographics ... most recent demographic-economic estimates for each/all 113th CDs ... API-based subject matter access ... interactive table -- http://proximityone.com/acs2013.htm#table 06.01.14. School Age Population Characteristics by 113th Congressional District ... examine school district characteristics within congressional districts. ... see more at Children's Demographics ... click graphic for larger view and details.  03.24.14. Geocode Address Data with 113th Congressional District ... what congressional district is my address located in? state legislative district? voting district? ... APIGeocoder: batch & interactive geocoding ... API-based geocoder can code addresses with wide-ranging geography & demographic-economic attributes. 02.17.14. 113th Congressional District Demographic Interactive Tables ... ACS 2012 1-year 113th Congressional District demographic-economic ranking tables ... General Demographics -- http://proximityone.com/cd11312dp1.htm ... Social Characteristics -- http://proximityone.com/cd11312dp2.htm ... Economic Characteristics -- http://proximityone.com/cd11312dp3.htm ... Housing Characterictics -- http://proximityone.com/cd11312dp4.htm 11.06.13. State Legislative Districts Urban/Rural Characteristics ... examine America's 6,558 state legislative districts by urban/rural population & land area ... interactive table: http://proximityone.com/sld2013.htm 09.23.13. ACS 2012 Demographic-Economic Updates ... new American Community Survey (ACS) 2012 1-year estimates - demographic-economic updates for each 113th Congressional District ... use the interactive table to examine demographic-economic patterns - see http://proximityone.com/cd_acs12.htm 09.20.13. 2012 Elections & Vote by Candidate ... Presidential, Senatorial and each Congressional election ... vote count and percent by election, party, candidate ... interactive analysis table: http://proximityone.com/2012elections.htm 04.11.13. Census 2010 SF1 Released for 113th Congressional Districts ... population by age, gender, race/origin; household type & relationship; group quarters ... housing units by own/rent/tenure; vacancy; related attributes ... retabulated for the congressional district boundaries of the 113th Congress ... more about Summary File 1 (SF1): http://proximityone.com/cen2010_sf1.htm 03.06.13. ACS 2011 1-year 113th Congressional District Interactive Ranking Tables ... ACS 2011 1-year 113th Congressional District demographic-economic ranking tables ... General Demographics -- http://proximityone.com/cd11311dp1.htm ... Social Characteristics -- http://proximityone.com/cd11311dp2.htm ... Economic Characteristics -- http://proximityone.com/cd11311dp3.htm ... Housing Characterictics -- http://proximityone.com/cd11311dp4.htm 03.04.13. ACS 2011 1-year 113th Congressional District Demographic Profiles ... New ACS 2011 1-year 113th Congressional District demographic-economic profiles ... View example for New York 12th -- http://proximityone.com/cd113_profiles.htm ... Data available for single districts, sets of districts or all districts in various formats ... Contact us for more information (mention ACS 2011 CD Profiles in text section) 03.01.13. Potential Impact of Sequester on School Districts by Congressional District ... mapping patterns of school districts by percent revenue from Federal sources ... view districts most vulnerable to reductions in Federal funding ... school districts shown in context of 113th Congressional Districts ... see http://proximityone.com/sdfa_cd.htm 02.01.13. Citizen Voting Age Population Patterns by Census Tract ... ACS 2011 5-year special tabulation estimates ... citizen voting age population by race/ethnicity ... using these data with tools to analyze compliance with Voting Rights Act ... interactive ranking table ... http://proximityone.com/tracts_cvap.htm ... visual analysis using GIS tools http://proximityone.com/cdgallery/guide/cvap.htm 01.28.13. 113th Congressional District Urban/Rural Characteristics ... urban/rural data developed using Census 2010 Summary File 1 data. ... urban and rural population and housing data summarized by 113th Congressional District. ... http://proximityone.com/cd113_2010_ur.htm. 01.25.13. 113th Congressional District Demographics ... new data based on American Community Survey 2011 1-year estimates. ... tabulations for the new 113th congressional district boundaries. ... http://proximityone.com/cd113_demographics.htm. 12.28.12. CD Gallery Updated: 113th Congress Congressional District Maps ... State by congressional district maps for all states; sub-state zoom-in for many states. ... District specific focus maps available in all states. - district focus maps show CD boundary and thematic pattern map. - thematic pattern: economic prosperity (median household income) by census tract. ... http://proximityone.com/cdgallery/guide/ 12.04.12. 113th Congressional Districts & School District Finances ... School district thematic maps (percent Federal revenue) in context of 113th CD boundaries. ... School district-CD map views: http://proximityone.com/sdfa_cd.htm. ... Applications Gallery: http://proximityone.com/gallery/guide/113th_congressional_districts.htm. 118th Congressional District 2020/2022 Demographics Interactive Table .. goto top Incumbent data shown in table has been updated through 2/14/24. Use the buttons & tools below the table for most effective use of this table and data. Click ShowAll button between Find/Queries. Use mouseover on column header to view column description. See usage notes below table. Usage Notes Most of the items in this table are based on American Community Survey 2022 1 year (ACS2022) estimates. .. those estimates are new as of 9/14/23 and will the most current CD118 demographic estimates until 9/24. The table also contains the Census 2020 population and shows the population change 2020 to 2022. • If table not showing any rows; click ShowAll button below table. • Use vertical and horizontal scroll bars to navigate up/down or left/right. • Adjust column widths using column divider between header cells. Items in Table - Incumbent - Stab - St - CD - StCD - Party - Population 2020 - Population 2022 - Population Change 2020-2022 - Population %Change 2020-2022 - Male, 2022 - Female, 2022 - White alone, 2022 - Black alone 2022 - AmerInd/AlNat alone, 2022 - Asian alone 2022 - NHOPI1 alone 2022 - OthRace 2022 - MultiRace, 2022 - Hispanic, 2022 - Pop 65+ 2022 - Pop in HH 2022 - Households 2022 - Families 2022 - Pop 25+ 2022 - HS Grads M 2022 - HS Grads F 2022 - Total Housing Units 2022 - Own Occ Hsg Units 2022 - Rnt Occ Hsg Units 2022 - Vacants units 2022 - Med HH Income 2022 - Med Fam Income 2022 - Med Hsg Value 2022 - Med Rent 2022 - Gini Index 2022 - CD Name" Census 2020 .. goto top Use the Demographic Analytics tool to compare Congressional Districts American Community Survey .. goto top .. annual richer demographics Congressional Communities & Congressional Districts .. goto top Predicting/Analyzing Policy Effects .. goto top Policymakers have many tools/resources available to examine policy outcomes. Predicting effects of alternative policies using statistical models can improve insights into unanticipated outcomes. Policymakers and stakeholders can benefit using the ProximityOne U.S. Macro Model to predict impact/levels using alternative assumptions. The U.S. Macro Model is updated quarterly with drill-down to the county level. Contact us to learn more about use of these resources. Some application areas are listed below. • COVID-19 Pandemic • Climate Change and the Environment • Defense • Veterans • Economy • Education • Equality • Gun Violence • Crime • Healthcare • Immigration • Federal agency rule-making • Transportation • Women's Economic Empowerment About this Section .. goto top This section is developed/updated by Warren Glimpse .. connect via LinkedIn. Schedule a talk/briefing by Warren for your group (face-to-face or Web) on Census-related topics, Census 2020, congressional districts, redistricting or related topics -- adjusted to your theme or sphere of interest. Send a message via LinkedIn, use this form (add note in text section) or call 888.364.7656. Support Using these Resources .. goto top Learn more about accessing and using demographic-economic data and related analytical tools. Join us in a Data Analytics Lab session. There is no fee for these one-hour Web sessions. Each informal session is focused on a specific topic. The open structure also provides for Q&A and discussion of application issues of interest to participants. ProximityOne User Group Join the ProximityOne User Group to keep up-to-date with new developments relating to geographic-demographic-economic decision-making information resources. Receive updates and access to tools and resources available only to members. Use this form to join the User Group. Additional Information ProximityOne develops geographic-demographic-economic data and analytical tools and helps organizations knit together and use diverse data in a decision-making and analytical framework. We develop custom demographic/economic estimates and projections, develop geographic and geocoded address files, and assist with impact and geospatial analyses. Wide-ranging organizations use our tools (software, data, methodologies) to analyze their own data integrated with other data. Contact ProximityOne (888-364-7656) with questions about data covered in this section or to discuss custom estimates, projections or analyses for your areas of interest. |
|
|