
|
|
|
-- examining geographic-demographic-economic characteristics and patterns December 2017. State Legislative Districts (SLDs) are areas from which members are elected to state or equivalent entity legislatures. The state legislative districts include the Upper/Senate (SLDU) and Lower/House (SLDL) chambers of the state legislature. In this section: • Use the interactive table below to examine demographic-economic characteristics • Create SLD Profiles using the table • Illustrative SLD Reports for specific SLDs • SLDs are diverse. See more about SLDs below • Join the Congressional District-State Legislative District Group; see below. • Join us in an upcoming face-to-face CDSLD Data Analytics Session. • See related sections. Patterns of Economic Prosperity - Virginia Upper/Senate SLDs by Median Household Income  - click graphic for better quality view CV XE GIS software and related GIS project Patterns of Economic Prosperity - Virginia Lower/House SLDs by Median Household Income  - click graphic for better quality view CV XE GIS software and related GIS project New York Metro House Districts & Economic Prosperity by ZIP Code Illustrative GIS application showing legislative districts contextually with other geography & subject matter. House districts black boundary & district code; patterns of median household income by ZIP code. 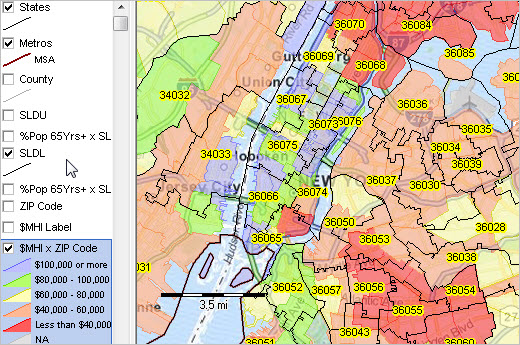 - View developed using CV XE GIS and related GIS project. - see below in this section about using this GIS project. 2014 State Legislative Districts (SLD) sections: • SLD Demographic-Economic Interactive Tables • SLD Demographic-Economic GIS Project/Datasets Congressional District-State Legislative District Group .. goto top The Congressional District-State Legislative District (CDSLD) Group is a forum intended for individuals interested in accessing and using geodemographic data and analytical tools relating to voting districts, congressional districts & state legislative districts. Join the CDSLD Group to receive updates on these topics, data analytics and access to GIS-related resources. .. there is no cost. 2016 State Legislative Districts -- Demographic-Economic Characteristics -- interactive table There is one row for each state legislative district. Click column header to sort; click again to sort other direction. See related interactive tables Table Notes and Usage Statistical Data from American Community Survey 2016 5-year estimates (ACS1216). Operations: • Click ShowAll button between queries. • To view the list of all Lower districts (summary level L): - click ShowAll button. - optionally select a state (left dropdown below table). - click District Type selector below table and choose L; table refreshes. To select one district ... suppose you want VA House 44: Click ShowAll button (always between queries). Use state dropdown below table, select Virginia (table refreshes with only VA districts). Use type dropdown below table, select SLDL (table refreshes with only VA SLDL districts). Scroll down to 51 011, click checkbox optionally right click blue area to copy to clipboard; paste in spreadhseet then transpose.. Items in Table .. see illustrative profile below State Legislative Districts Reports .. goto top .. prepared for individual SLDs. .. state legislative district visual analyses; collaborating with these resources; examples: - Virginia House District 11 (Roanoke) - Virginia House District 44 (Fairfax County) - Virginia Senate District 36 (Fairfax- Prince William - Stafford Counties) Create State Legislative Districts Profiles .. goto top .. prepare for individual/comparison SLDs using the table above. Example for VA House Districts 11 & 44: .. access this profile as an XLS file developed from table above. Comparing Two Districts
2016 State Legislative Districts .. goto top All 50 states, and D.C. and Puerto Rico, participated in Phase 4 of the Census Bureau Redistricting Program, as part of P.L. 94-171. All states and areas provided the Census Bureau with the 2016 election cycle boundaries, codes, and in some cases names for their state legislative districts. States provided updates for their boundaries used in the November 2016 elections for the session that began in January 2016. The Census Bureau develops standardized SLDU and SLDL shapefiles. The following states had changes to their state legislative districts for 2016: Florida (upper house only), Minnesota, Maryland (lower house only), Georgia (lower house only). As of 2016, the 6,558 state legislative districts in the U.S. are comprised of 4,629 lower/house chambers and 1,929 upper/senate chambers. Of the total state legislative districts, 1,257 are 100-percent urban (every census block comprising the district is urban), 19 are 100-percent rural, and 927 are less than 1-percent urban. Use the interactive table in this section to view, rank, compare state legislative districts by rural and urban population and geographic area. SLD Mapping and GeoSpatial Analysis Use GIS tools to visually examine U.S. or state by state legislative district patterns such as percent population urban. 2016 State Legislative District (SLD) boundaries used here are based on the TIGER/Line shapefiles. 2016 SLDs - Upper click graphic for view  2016 SLDs - Lower click graphic for view  Related Sections .. goto top Congressional Districts - CD Map Gallery - 2016 115th Congressional Districts interactive tables: .. General Demographics .. Social Characteristics .. Economic Characteristics .. Housing Characteristics - urban/rural: .. Urban-Rural Analysis - incumbents & analysis: .. Incumbents & GIS - relationship data: .. ZIP Code to CD 114 Voting Related - CVAP x Tract - CVAP x 114th CD - Voting Districts - Voting Population - Voter Participation Support Using these Resources .. goto top Learn more about demographic economic data and related analytical tools. Join us in a Data Analytics Lab session. Each informal session is focused on a specific topic. The open structure also provides for Q&A and discussion of application issues of interest to participants. ProximityOne User Group Join the ProximityOne User Group to keep up-to-date with new developments relating to geographic-demographic-economic decision-making information resources. Receive updates and access to tools and resources available only to members. Use this form to join the User Group. Additional Information ProximityOne develops geodemographic-economic data and analytical tools and helps organizations knit together and use diverse data in a decision-making and analytical framework. We develop custom demographic/economic estimates and projections, develop geographic and geocoded address files, and assist with impact and geospatial analyses. Wide-ranging organizations use our tools (software, data, methodologies) to analyze their own data integrated with other data. Follow ProximityOne on Twitter at www.twitter.com/proximityone. Contact us (888-364-7656) with questions about data covered in this section or to discuss custom estimates, projections or analyses for your areas of interest. | ||||||||||||||||||||||||||||||||||||||||||||||||||||||||||||||||||||||||||||||||||||||||||||||||||||||||||||||||||||||||||||||||||||||||||||||
|
|