
|
|
|
Analyzing State Demographic-Economic Trends Use tools and data reviewed in this section to examine U.S. state level geographic, demographic and economic characteristics and trends. Frequently updated, these data provide insights for decision-making -- how, where, when and by how much things are changing and how this change might affect you. Use the interactive table below to examine how the population and housing changed from 2000 to 2010 by state. This section updates frequently. See updates section below for a list of updates. See related new State of the States section. How State Quarterly GDP is Changing - assessing the impact of the pandemic.  U.S. & State Personal Consumption Expenditures by Type: 2010-2018 - interactive table & GIS applications - 2010-2018 annual time series; expenditures by category U.S. & State Real Median Household Income Trends: 2005-2018 - interactive table & GIS applications - 2005-2018 annual time series How & Why are the Demographics of States Changing? - click a state link in the scroll section at right to learn more. - use this interactive table to view, sort, query and examine annual population and components of change 2010-2018 How & Why are State Economies Changing? - click a state link in the scroll section at lower right to learn more. - view 5 types of economic characteristics/profiles showing change since 2010. Patterns of Economic Prosperity by State The following graphic shows patterns of median household income by state. Yellow label shows the state USPS abbreviation; white label shows $MHI. Legend shows color patterns associated with percent population change.  - View developed using CV XE GIS software and associated GIS project. - use these resources to develop similar views for any area. Modify subjects, zoom, colors, labels, add your data. Selected Updates (scroll section) ...
10.17.19 U.S. & State Real Median Household Income
... interactive table & GIS applications ... 2005-2018 annual time series 07.25.19 U.S. & States of the States ... frequently updated U.S. and individual state demographic-economic characteristics & trends sectionse ... State of the States 01.07.19 U.S. & States 2010-2018 Population & Components of Change ... 2018 estimates and start the 2019 demographic estimates cycle ... see details & interactive table to compare/rank states 10.31.18. U.S. & States 2017 Demographic-Economic Characteristics ... 4 sections/files .. General Demographics .. Social .. Economic .. Housing 07.30.18. Examining U.S. by State Migration ... http://proximityone.com/statemigration.htm ... interactive table .. state-to-state migration in 2016 ... GIS/mapping resources; annual data 2010-2017 Patterns of migration by state 2010-2017  12.22.17. Examining U.S. by State Population & Population Change ... using new (released 12/17) state population and components of change data ... http://proximityone.com/states2017.htm ... interactive table and GIS/mapping resources; annual data 2010-2017 Patterns of population change by state 2010-2017  09.27.17: State of the States Updates ... 2016 Demographic-Economic Characteristics ... General Demographics .. Social .. Economic .. Housing 07.30.17. State Quarterly GDP by Industry ... interactive table and GIS analytical resources ... see http://proximityone.com/stategdpq.htm 04.20.17. State Annual GDP ... interactive table and GIS analytical resources ... see http://proximityone.com/stategdp.htm 01.03.17. U.S. by State Demographic Projections to 2040 ... create your own proprietary demographic-economic estimates & projections ... create alternative scenario U.S. by state projections to 2040 ... population and components of change annually 2010 through 2040 ... using Modeler Level 1 Predictive Analytics Software ... use output with any analytical software such as Excel or CVGIS Mapping & Data Analytics ... http://proximityone.com/modeler_level1.htm California annual data; partial view  12.22.16. Examining U.S. by State Population & Population Change ... using new (released 12/16) state population and components of change data ... http://proximityone.com/states2016.htm ... interactive table and GIS/mapping resources; annual data 2010-2016 Patterns of population change by state 2010-2016  10.22.16. Examining State Diversity 2015 ... http://proximityone.com/diversity2015.htm ... State Diversity Index 2015; interactive table with related race/origin pattern data; GIS/mapping resources State Diversity Index by State & Patterns of %NonWhite Population  07.22.16. State Population Profiles/Tables; 2010-2015; Selected Attributes ... annual estimates 2010-2015 ... components of change, race/origin, single-year age, 5-year age cohorts, selected age groups. ... see http://proximityone.com/stateage.htm 06.03.16. Regional Demographic-Economic Modeling System ... examine demographic-economic characteristics, patterns and trends for states & sub-state areas ... interactive access -- http://proximityone.com/rdems.htm 04.08.16. State-of-the-States: 2010-2015 ... examining the how, why and where of state population change ... 2010-2015 annual population estimates & components of change ... state by state reports ... see http://proximityone.com/state-of-the-states.htm Patterns of Population Change by State & County, 2010-2015 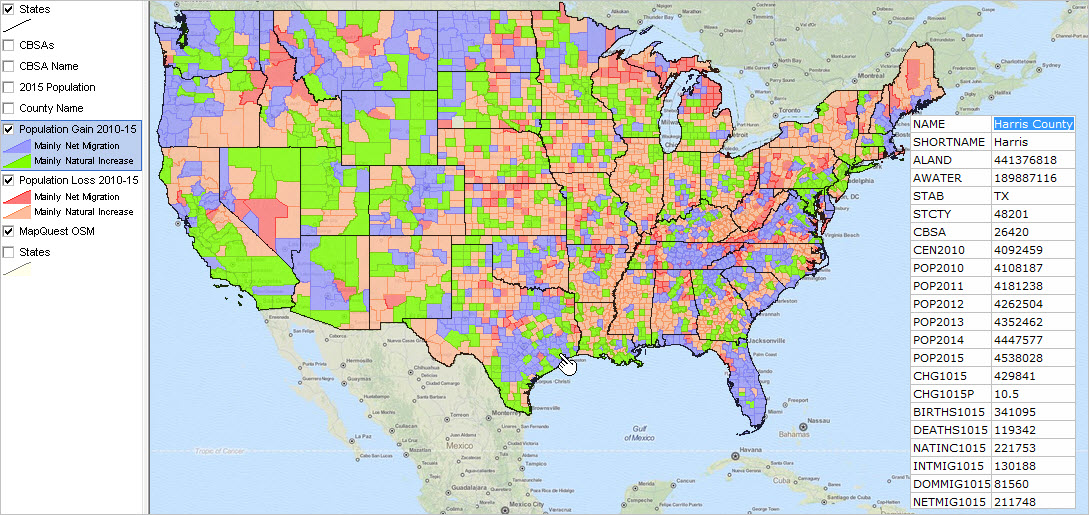 12.26.15. State Population & Personal Income: 2010-2015 ... U.S. by state population and personal income estimates; annual series ... interactive table; downloadable GIS resources ... see http://proximityone.com/states2015.htm Patterns of 2015 State PCPI & Population  11.16.15. U.S.-State-Metro Demographic-Economic Interactive Analysis ... examining patterns & characteristics of individual/all state ... 2014 attributes of states & current vintage metros General Demographics | Social Characteristics | Economic Characteristics | Housing Characteristics 11.02.15 State Median & Mean Household & Family Income 2012-2014 ... examining patterns of well-being ... interactive table, data profiles & GIS applications ... http://proximityone.com/state_income.htm 01.26.15. Daytime Population: U.S. by State & County ... annual update based on ACS 2013 ... interactive table; GIS project: http://proximityone.com/daytime_population2013.htm ... Atlanta metro area by county: patterns of employment-residence ratio:  01.20.15. State Patterns of Income & Income Inequality ... 2012. 2013 median household income & Gini Index -- dataset, interactive table, GIS project ... http://proximityone.com/state_mhi2013.htm ... visual analysis of the Gini Index; measure of income inequality:  12.26.14. State Population & Components of Change Estimates 2010-2014 ... accessing & using estimates & trends data -- dataset, interactive table, GIS project ... http://proximityone.com/state_pop2014.htm  12.24.14. State-to-State Geographic Mobility: Migration Flows in 2013 ... examining state-to-state migration -- dataset, interactive table, GIS project ... http://proximityone.com/state_migration2013.htm  09.26.14. State of the States 2013 ... state by state demographic characteristics ... interactive table -- http://proximityone.com/states2013.htm  09.18.14. Easy Access to ACS 2013 1 Year Estimates ... all areas/all types of areas for which 1-year data tabulated ... API-based subject matter access ... see interactive table -- http://proximityone.com/acs2013.htm#table 05.16.14. Rental Market Conditions by State & Metropolitan Area; 2014 Update ... http://proximityone.com/metro_rentalmarket_2014.htm ... U.S., states and metros -- interactive housing market characteristics table  04.28.14. Real Personal Income for States & Metros - component of ProximityOne Situation & Outlook Database - interactive ranking table -- http://proximityone.com/metro_rppi.htm  04.03.14. ChartGraphics Population Pyramids ... http://proximityone.com/chartgraphics.htm ... visual analysis of age-cohort patterns ... ready-to-use U.S. by state, county, school districts; world by country ... China, Total Population, 2050  03.03.14. State by Neighborhood Patterns GIS Projects ... state by neighborhood GIS projects; no fee usergroup resources ... ready-to-use projects to analyze neighborhood demographic-economic patterns ... http://proximityone.com/neighborhood_patterns.htm 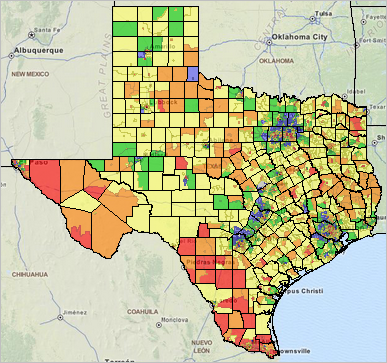 01.22.14. State & Metro Demographic-Economic Interactive Tables ACS 2012 1 year estimates (U.S., state, CBSA) General Demographics .. Social Characteristics .. Economic Characteristics .. Housing Characteristics ACS 2012 5 year estimates (U.S., state, metro, county) General Demographics .. Social Characteristics .. Economic Characteristics .. Housing Characteristics 01.20.14. State Personal Income Patterns ... quarterly updates through 2013Q3 ... interactive table: http://proximityone.com/state_personalincome.htm 12.13.13. State Population Projections to 2030 ... examine annual population and population change from 2010 to 2030 ... interactive table: http://proximityone.com/outlook2030_states.htm 10.28.13. State Median Household Income; 2000-2012 ... real U.S. median household income decreased 6.6 percent,2000-2012 ... interactive table and thematic pattern mapping ... see http://proximityone.com/statetrendsmhi_20002012.htm 07.02.13. State Population Components of Change ... examine annual population components of change since 2010 ... how are births, deaths and migration impacting state population? ... see http://proximityone.com/statetrends2012.htm 06.28.13. State Single Year of Age 2010-2011-2012 Updates/Profiles ... examine 2010, 2011, 2012 population estimates by single year of age ... how are cohorts of interest changing? U.S. and individual state profiles ... see http://proximityone.com/stateage.htm 05.31.13. City, County, State Daytime Population ... examine workers living/working in area; population change due to commuting; employment/residence ratio ... view, rank, compare cities, counties and states; interactive ranking table ... see http://proximityone.com/daytime_population.htm 12.20.12. State Metro County Demographic-Economic Ranking Tables ... several hundred (600+) most widely used subject matter items; all states, metros, counties ... based on ACS 2011 and related data; released December 2012 ... view/rank/compare state demographic-economic attributes; develop regional profiles ... General Demographics -- http://proximityone.com/us11dp1.htm ... Social Characteristics -- http://proximityone.com/us11dp2.htm ... Economic Characteristics -- http://proximityone.com/us11dp3.htm ... Housing Characteristics -- http://proximityone.com/us11dp4.htm 10.16.12. School Enrollment by State by Age and Type of Enrollment ... Examine U.S. trends 2008-2011 ... Use interactive ranking table to view/compare/rank states by type of enrollment ... http://proximityone.com/school_enrollment.htm 10.12.12. State Employment Situation: Interactive Ranking Table ... Monthly updates ... View/query/sort/compare labor force size, characteristics and change ... http://proximityone.com/state_employment.htm 10.08.12. U.S. & State ACS 2011 interactive ranking tables ... New demographic-economic American Community Survey data released September 2012 ... U.S., states, metros/MSAs, counties, cities, congressional districts ... Several hundred most widely used subject matter items ... General Demographics -- http://proximityone.com/acs2011dp1.htm ... Social Characteristics -- http://proximityone.com/acs2011dp2.htm ... Economic Characteristics -- http://proximityone.com/acs2011dp3.htm ... Housing Characteristics -- http://proximityone.com/acs2011dp4.htm 10.01.12. Situation & Outlook State Demographic-Economic Profiles
... profiles showing wide-ranging demographic-economic attributes.
... continuously updated; features data from ACS 2011 released in September 2012. ... Census 2000, ACS 2011 and change & with more current 2012 monthly updates. ... select U.S. or scroll to state of interest:
United States
Alabama Alaska Arizona Arkansas California Colorado Connecticut Delaware District of Columbia Florida Georgia Hawaii Idaho Illinois Indiana Iowa Kansas Kentucky Louisiana Maine Maryland Massachusetts Michigan Minnesota Mississippi Missouri Montana Nebraska Nevada New Hampshire New Jersey New Mexico New York North Carolina North Dakota Ohio Oklahoma Oregon Pennsylvania Rhode Island South Carolina South Dakota Tennessee Texas Utah Vermont Virginia Washington West Virginia Wisconsin Wyoming 09.21.12. Analyzing State Household Income Patterns: 2010-2011 http://proximityone.com/statetrends_income.htm ... household income continues to decline ... examine where and by how much ... interactive ranking table ... view/rank/query U.S. & States Population & Housing Patterns: 2000-2010 ... interactive ranking table ... click column header to sort; click again to sort other direction. ... see related ranking tables main page Column Headers and Usage Notes - Population '00 -- Population, Census 2000 - Population '10 -- Population, Census 2010 - PChg0010 -- Population Change 2000-2010 - P%Chg0010 -- Population Percent Change 2000-2010 - Hsg Units '00 -- Housing Units, Census 2000 - Hsg Units '10 -- Housing Units, Census 2010 - HChg0010 -- Housing Units Change, 2000-2010 - H%Chg0010 -- Housing Units Percent Change, 2000-2010 ProximityOne User Group Join the ProximityOne User Group to keep up-to-date with new developments relating to metros and component geography decision-making information resources. Receive updates and access to tools and resources available only to members. Use this form to join the User Group. Support Using these Resources Learn more about accessing and using demographic-economic data and related analytical tools. Join us in a Data Analytics Lab session. There is no fee for these one-hour Web sessions. Each informal session is focused on a specific topic. The open structure also provides for Q&A and discussion of application issues of interest to participants. Additional Information ProximityOne develops geodemographic-economic data and analytical tools and helps organizations knit together and use diverse data in a decision-making and analytical framework. We develop custom demographic/economic estimates and projections, develop geographic and geocoded address files, and assist with impact and geospatial analyses. Wide-ranging organizations use our tools (software, data, methodologies) to analyze their own data integrated with other data. Follow ProximityOne on Twitter at www.twitter.com/proximityone. Contact us (888-364-7656) with questions about data covered in this section or to discuss custom estimates, projections or analyses for your areas of interest. |
|
|