
|
|
Personal Consumption Expenditures by Type & State
.. using Personal Consumption Expenditures (PCE) measures to monitor/examine the strength of a regional economy and consumer buying trends in that region and compare among regions ... PCE estimates released in October 2019, show that state personal consumption expenditures increased 5.1 percent in 2018, an acceleration from the 4.4 percent increase in 2017. The percent change in PCE across all states ranged from 7.3 percent in Utah to 3.6 percent in West Virginia. Across all states and D.C., per capita PCE was $42,757. Per capita PCE by state ranged from a high of $55,095 (MA) to a low of $31,083 (MS). Per capita PCE in D.C. $63,151. Use the interactive table below to example per capita and total PCE by state for 24 categories annually 2010 to 2018. Per Capita Personal Consumption Expenditures by Category; U.S. 2018 -- how does your situation and areas of interest compare to U.S. overall? -- view, sort, query by state and year in the interactive table below
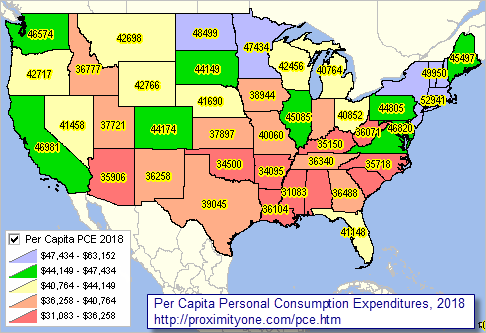
Goods and services purchased by people are personal consumption expenditures (PCE). These data provide insights into the strength of a state economy and consumer buying trends. As a major component of GDP, PCE growth has recently accounted for much of the GDP growth. The data reviewed in this section are developed by the Bureau of Economic Analysis (BEA, released each October). ProximityOne develops regional PCE estimates by metro and county. More about PCE below. See related sections: • State Real Median Household Income • State Annual Gross Domestic Product by Industry Per Capita Consumption Expenditures by State, 2018 The following graphic shows patterns of 2018 per capita personal income expenditures (PCE). Intervals show distribution in quintiles, equal number of states per interval. The 2018 U.S. per capita PCE was $42,757. Use CV XE GIS project to examine PCE by types, per cpaita vs total, different years and change. Integrate additional subject matter and types of geography. Click graphic for larger view with details. Expand browser window for best quality view. 
- view developed with ProximityOne CV XE GIS and related GIS project & datasets. Personal Consumption Expenditures by Type and State: 2010-2018 Click column header to sort; click again to sort other direction. Table shows annual columns for per capita PCE and total PCE. See related Interactive Tables Usage Notes - View all PCE categories by using Find in Name. - Click on a column header to sort on that column; click column header again to sort in other direction. - Click ShowAll button to show all areas and restore full set of data view. Column Headers - AreaName - Region - Code - PCE Type - PCE Type - per capita PCE 2010 - per capita PCE 2011 - per capita PCE 2012 - per capita PCE 2013 - per capita PCE 2014 - per capita PCE 2015 - per capita PCE 2016 - per capita PCE 2017 - per capita PCE 2018 - Change per capita PCE 2010-18 - %Change per capita PCE 2010-18 - PCE 2010 - PCE 2011 - PCE 2012 - PCE 2013 - PCE 2014 - PCE 2015 - PCE 2016 - PCE 2017 - PCE 2018 - Change PCE 2010-18 - %Change PCE 2010-18 About PCE Whether you're picking up coffee, paying for cellphone service, or buying a car, that's consumer spending. Spending by consumers (or on their behalf, like an insurance company paying part of your hospital bill) is a big force in the nation's economic growth. Measures of spending by U.S. consumers are personal consumption expenditures or PCE. Examine questions like: • How strong was consumer spending compared in an earlier period? • What types of goods or services experienced a rise in spending? • How did a sharp increase in food or energy prices affect consumer spending? The Personal Consumption Expenditures (PCE) estimates are an integral part of the U.S. national income and product accounts (NIPA). PCE is the primary measure of consumer spending on goods and services in the U.S. economy. It accounts for about two-thirds of domestic final spending, and thus it is the primary engine that drives future economic growth. PCE shows how much of the income earned by households is being spent on current consumption as opposed to how much is being saved for future consumption. PCE also provides a comprehensive measure of types of goods and services that are purchased by households. PCE shows, for example, the portion of spending that is accounted for by discretionary items, such as motor vehicles, or the adjustments that consumers make to changes in prices, such as a sharp run-up in gasoline prices. The State PCE estimates are developed as an annually updated time series by the Bureau of Economic Analysis. The 2019 estimates will be available in October 2020. Support Using these Resources Learn more about accessing and using demographic-economic data and related analytical tools. Join us in a Data Analytics Lab session. There is no fee for these one-hour Web sessions. Each informal session is focused on a specific topic. The open structure also provides for Q&A and discussion of application issues of interest to participants. Additional Information ProximityOne develops geodemographic-economic data and analytical tools and helps organizations knit together and use diverse data in a decision-making and analytical framework. We develop custom demographic/economic estimates and projections, develop geographic and geocoded address files, and assist with impact and geospatial analyses. Wide-ranging organizations use our tools (software, data, methodologies) to analyze their own data integrated with other data. Follow ProximityOne on Twitter at www.twitter.com/proximityone. Contact us (888-364-7656) with questions about data covered in this section or to discuss custom estimates, projections or analyses for your areas of interest. |
|
|