
|
|
|
|
School District Population Change: 2000 to 2010
As of Census 2010, there were 13,709 school districts in the United States. The interactive ranking table provided below shows the Census 2000 population, Census 2010 population and Census 2000 to Census 2010 population change for school districts defined as of Census 2010. Only school districts defined as of Census 2010 are included. If the district did not exist as of Census 2000, the Census 2000 column shows a zero value. Patterns of School District Population Change 2000-2010 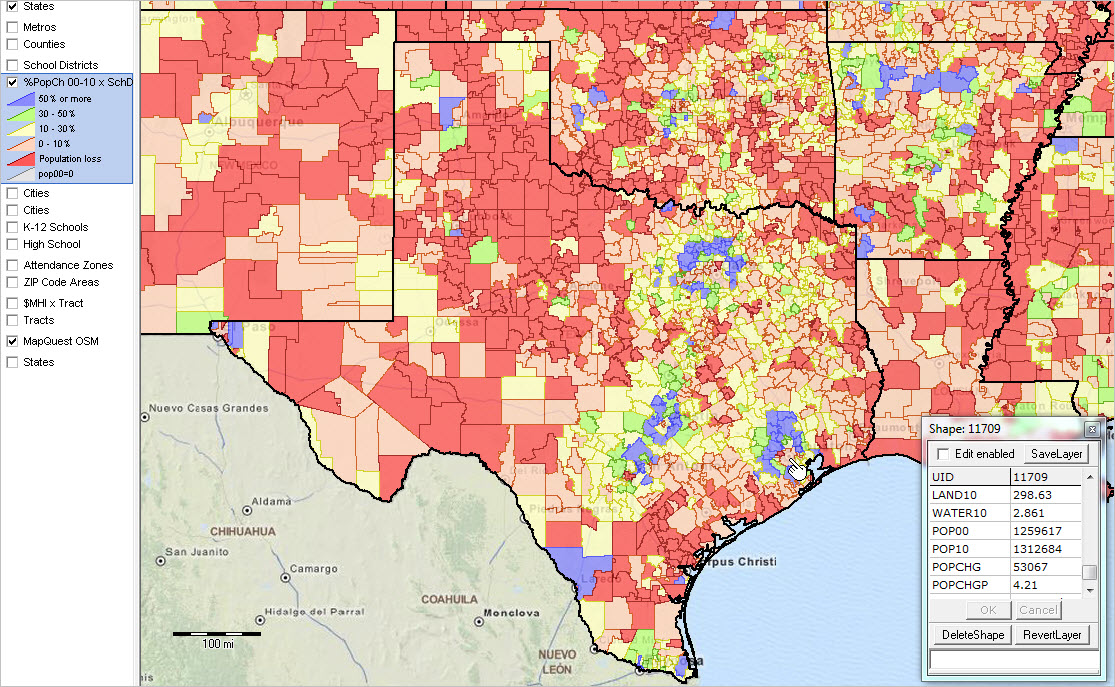 ... Click graphic for larger view. ... View developed using CV XE GIS. Map your own districts of interest. Use the ranking table to view the largest school districts in 2000 or 2010 or districts experiencing largest change. Apply a query/select a state to view school districts in a selected state. Click a column header on a subject of interest; click a second time to sort in the other direction. School District Population Change: 2000 to 2010 -- Interactive Ranking Table See related ranking tables. To view school districts by type, use SumLev dropdown below table. Click ShowAll button between queries. Land SqMi 2010 -- district land area in square miles, January 2010 Wtr SqMi 2010 -- district water area in square miles, January 2010 Support Using these Resources Learn more about demographic economic data and related analytical tools. Join us in a Data Analytics Lab session. There is no fee for these Web sessions. Each informal session is focused on a specific topic. The open structure also provides for Q&A and discussion of application issues of interest to participants. ProximityOne User Group Join the ProximityOne User Group to keep up-to-date with new developments relating to geographic-demographic-economic decision-making information resources. Receive updates and access to tools and resources available only to members. Use this form to join the User Group. Additional Information ProximityOne develops geographic-demographic-economic data and analytical tools and helps organizations knit together and use diverse data in a decision-making and analytical framework. We develop custom demographic/economic estimates and projections, develop geographic and geocoded address files, and assist with impact and geospatial analyses. Wide-ranging organizations use our tools (software, data, methodologies) to analyze their own data integrated with other data. Follow ProximityOne on Twitter at www.twitter.com/proximityone. Contact ProximityOne (888-364-7656) with questions about data covered in this section or to discuss custom estimates, projections or analyses for your areas of interest. |
|
|