
|
|
|
-- demographic-economic-geographic data & analysis The approximately 13,500 U.S. regular school districts operate approximately 100,000 schools and provide public educarion to approximately 50 million students. Use the interactive table below to examine characteristics of one, a selected group or all school districts. In this Section • interactive mapping tool to locate/examine a school/school district based on address/location. • interactive table to view, rank, compare, each/all school districts. .. E-mail us for more information, updates and briefs or call (888-364-7656). Join us in the weekly web sessions to learn more about understanding geographic, demographic and economic characteristics of K-12 schools and school districts. Learn about your school district sources and uses of funds, using the latest data. Knowing Your School(s) & School District(s) .. using iVDA part of Visual Data Analytics .. more options available using VDAGIS Discovery The start-up view is presented below in an interactive mapping window. Locate a school or school district .. see it on a map .. examine its demographics Click a box to view instructions. Find a school district based on an address/location .. click to view details.. in the iVDA frame below, enter an address or location like:33606 N. 60th Street, Scottsdale, AZ 85266 - then press enter. .. the map view zooms to that location shown as a blue marker and shows the corresponding school district as cross-hatched. .. view the demographic profile for this school district displayed in the lower left. .. here you can examine many demographic subject matter items for that school district. .. see the profile for this school district in the lower left panel. .. in this example the school district is Cave Creek Unified, AZ with population 62,076 and total enrollment of 4,837. .. click on layers in the Legend Panel: - K-12 Schools Elem .. shows elementary schools as yellow square markers - K-12 Schools Middle .. shows middle schools as green circle markers - K-12 Schools High .. shows high schools as small blue triangle markers - School Districts .. boundaries - School Districts Label .. school district name as label - Tracts LMI23 MFI Tracts/MSA% .. school district neighborhoods this layer shows patterns of the median family income (MFI) for tracts as a percent of the MFI for the metro(MSA) .. see more about low and moderate income (LMI) .. see the blog -- how and why census tract demographics can be used to examine K-12 school enrollment zones. .. try a different address or location, maybe the ZIP code "85258" or any address/location. .. the view will zoom to that school district. Examining Characteristics of a School.. starting from the above view, suppose that you want characteristics of a high school... click on the layer name for K-12 Schools High .. this makes it the "active layer". .. high schools are shown in the map with small blue triangles. .. click on a high school marker to view its profile in the lower left panel. .. for an elementary school: .. starting from the above view, suppose that you want characteristics of an elementary school. .. click on the layer name for K-12 Schools Elem .. this makes it the "active layer". .. elementary schools are shown in the map with small yellow square. .. click on an elementary school marker to view its profile in the lower left panel. How to assign a label (such as school name) to a school marker. .. make the school layer (e.g. K-12 Schools High) .. do this by clicking the name of the layer .. it turns blue. .. from the iVDA menu at the top of the iVDA form, click Tools>Layer Editor .. choose an item to use, such as Name. Click Set & Close the form. .. the map view now shows schools with that label. .. navigate the map view to avoid clutter from too much detail. .. click on a school/marker of interest to view a profile in the lower left panel. Subject Matter Items in school district profile .. from clipboard, pasted into XLSX. Selected Topics .. updates irregularly Percent Grade Relevant Children in Poverty by School District, 2022 In 2022, 12.6% of the United States population 325,521,470 for whom poverty status was determined or 40,951,625 were in poverty. Among the school districts with total population 5,000 or more (8,127), there were 4,227 districts with a percent grade relevant school age children with a poverty rate above 12.6%. Use the interactive table to view, sort, rank, query U.S. national scope school district 2022 population and income characteristics. The yellow interval, 12-13%, corresponds to the U.S. national poverty rate. Blue and green patterns are below national rate; salmon and red color patterns are above the national rate -- areas where children might be more challenged to achieve better levels of education and higher levels of educational attainment. 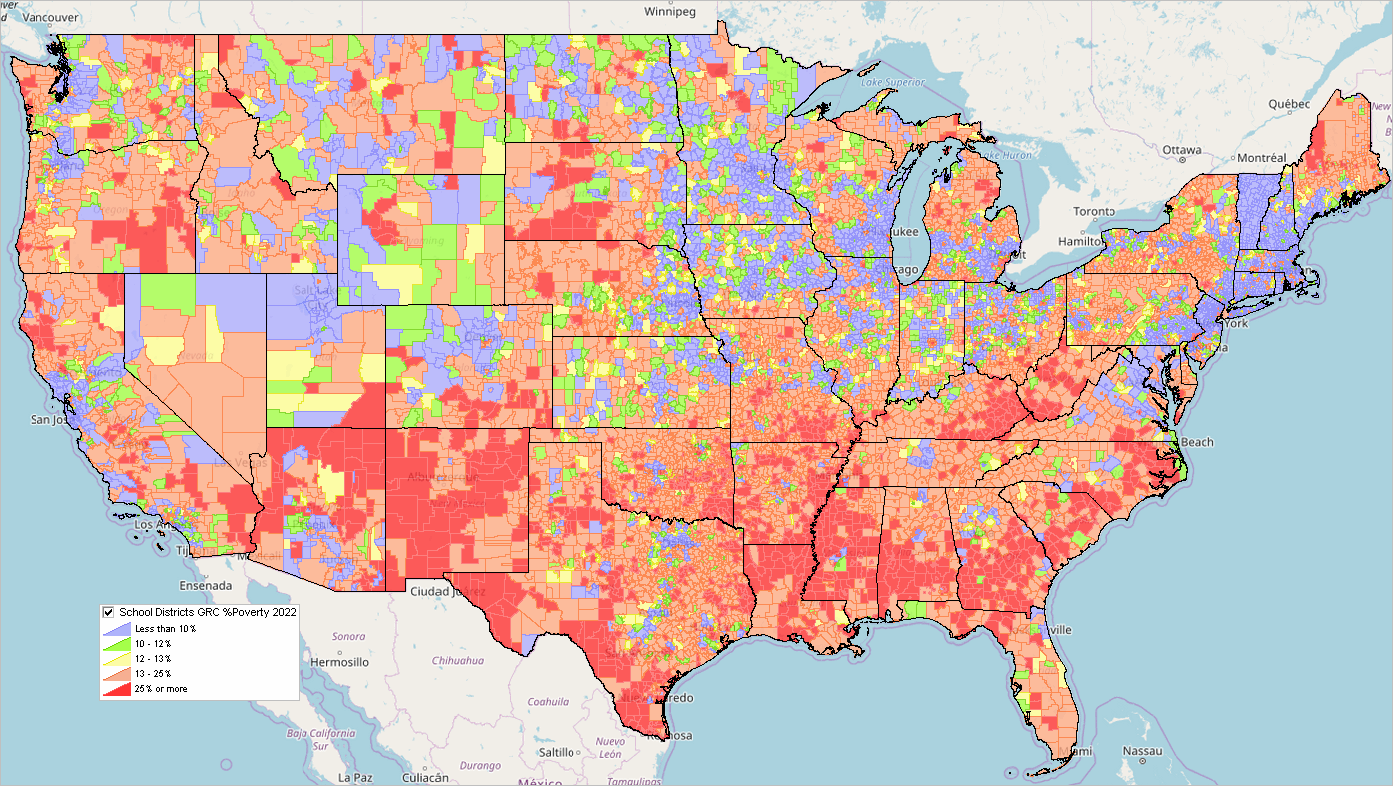 .. click graphic for larger view; expand to full windoe for best quality view. School District Finances Which school district(s) have the highest Federal revenue as a percent of total revenue? .. what about your school districts of interest? Consider the objective of getting a list Virginia school districts ranked in descending order based on Federal revenue as a percent of total revenue and view a map of the top ranked district. The graphic below illustrates the answer. Lee County Public Schools has the highest Federal revenue as a percent of total revenue based on the FY 2021 (most recent data available) sources & uses of funds data available for all Virginia school districts. See steps below graphic to replicate this for any state or U.S. 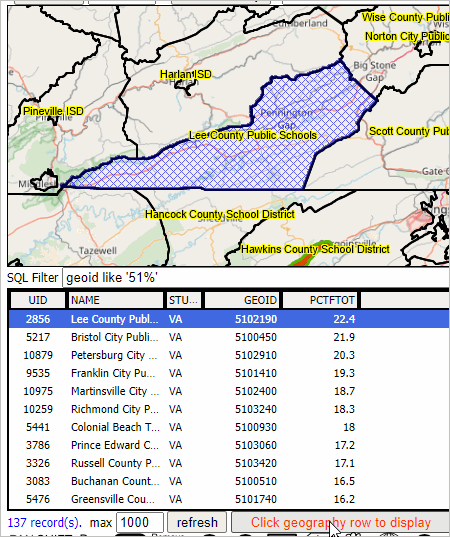 Get started ... a few minutes away ... Get a demographic-economic profile for your district using OVDAW: • about OVDAW • click to start OVDAW • In upper left dropdown, select School Districts layer • In searchbar above map, enter "Laguna Beach" (no quotes) and press enter • Map view zooms to that location. • Click blue marker; Laguna Beach school district highlights (cross-hatched) • Profile for this district shows in lower left panel. • Click HTML button below profile. • Scroll down in HTML page to see "F33" (school district finances) items • See that total revenue (for example) shows 76231 ($76,231,000) • See full profile here (xls) .. this might differ if this dataset has been updated Try your district! Not sure of details? Questions? Join us in the every Tuesday Web sessions. Topics in this section • 01 School District Interactive Table & Profiles • 02 Demographic-Economic Data Explorer • 03 VDA GIS Tools • 04 Geographic Solutions and Demographic-Economic Estimates & Projections • 05 Web meetings Interactive Table & Profiles Use the interactive table below to view, rank, compare selected characteristics of each/all more than 13,000 school districts. New 2021-22 school year data have been recently added. Demographic-Economic Data Explorer Use the Demographic-Economic Data Explorer (DEDE) to access and create datasets drawn from Federal Statistical System Use DEDE to develop Comparative Analysis Profiles • Illustrative examples: ... Los Angeles Unified & Houston ISD ... Wichita USD KS & Kansas • Request one for your district; use this form .. enter primary & comparison district names in text box. • Illustrating side by side comparison of an ESD intersecting with corresponding SSD in Fresno, CA area ... Click to view Alvina ESD CA & Caruthers SSD CA HTML ACS 2019 5-year Caruthers district comprised of two separate parts 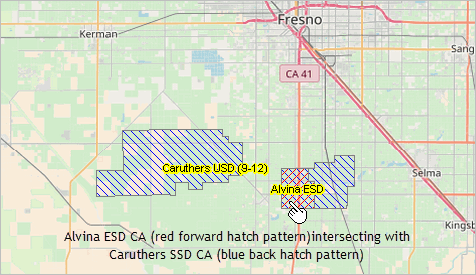 VDA GIS Tools Use the Visual Data Analytics (VDA) Web GIS to map and geospatially analyze schools and school districts in context of other geography and subject matter. GIS (Geographic Information System) tools can do more than just make maps. They help us understand patterns and relationships that can only be with this technology. Below are some examples of using VDA GIS tools. Patterns of Poverty Rate for Population Ages 5-17 by School District 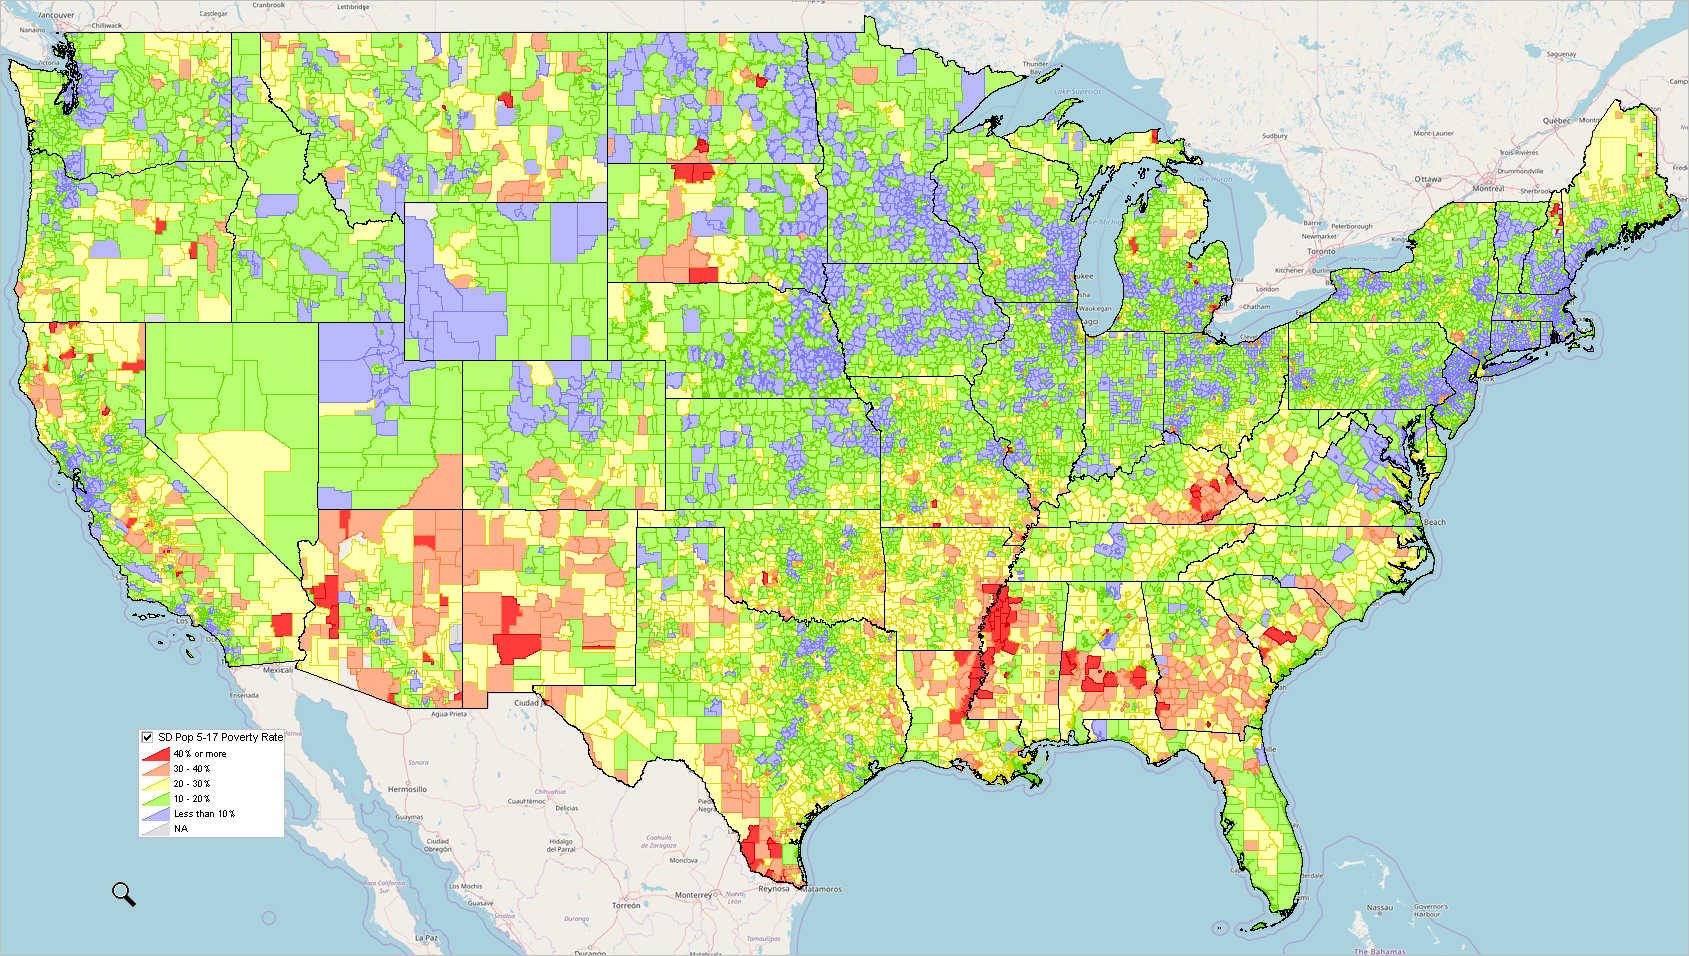 .. click graphic for larger view. .. see notes below for additional detail. Elementary, Secondary, Unified School Districts .. illustrative examples for the extended Los Angeles, CA area .. most states have only unified districts .. elementary districts 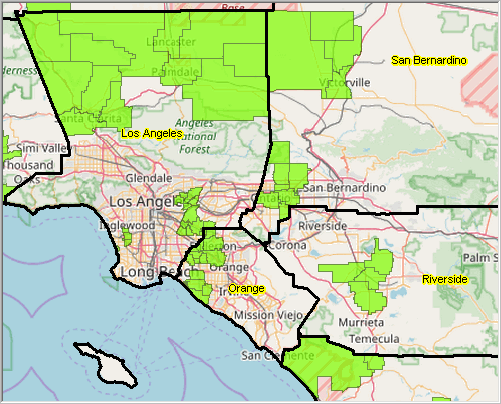 .. secondary districts 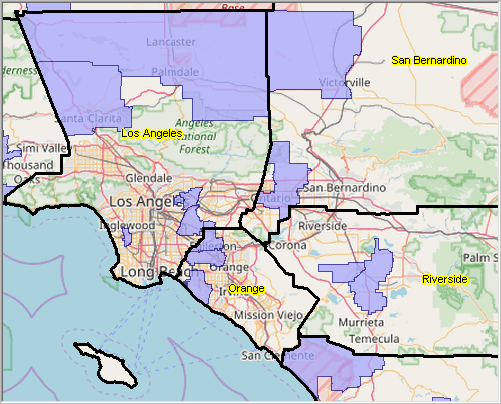 .. unified districts; LA Unified shown with darker color .. nationally, unified districts comprise approximately ~10,000 of total ~13,000 districts 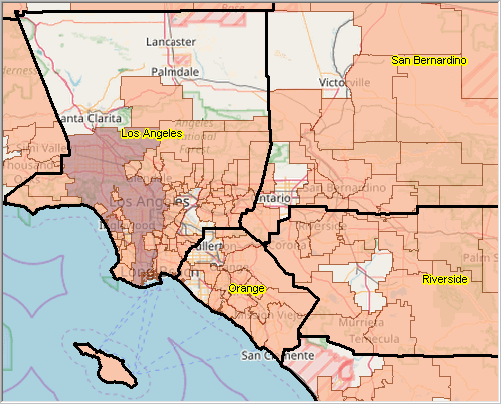 Patterns of Poverty Rate for Population Ages 5-17 by School District .. Fresno, CA region zoom-in .. bold boundaries show counties .. legend shows color patterns associated with poverty rates 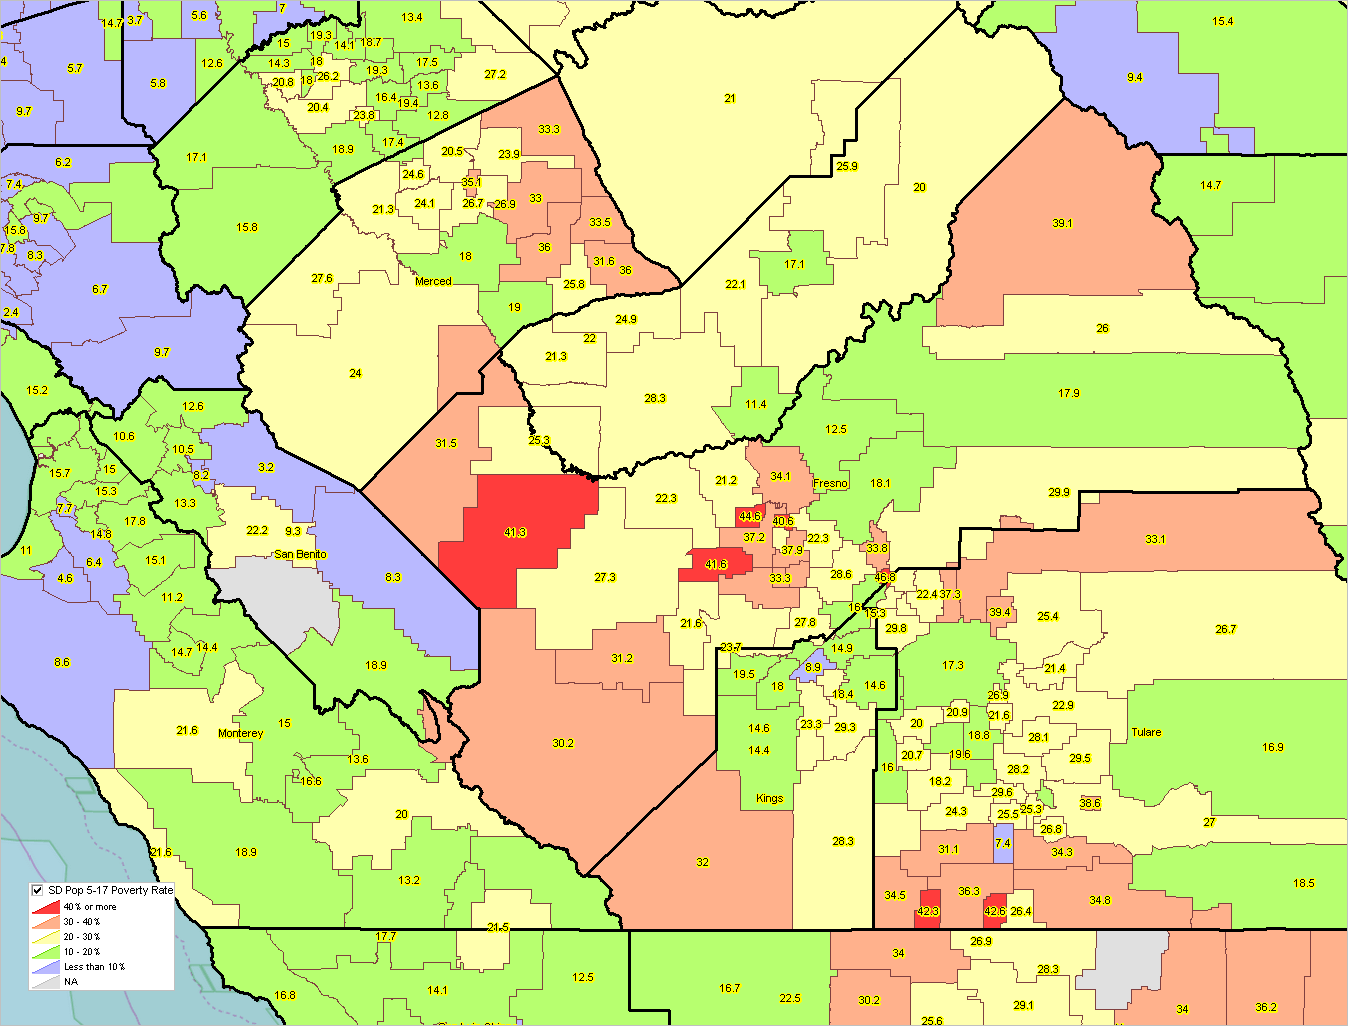 .. click graphic for larger view .. view poverty rates as labels by district .. expand browser window for best quality view. .. see notes below for additional detail. Geographic Solutions and Demographic-Economic Estimates & Projections - Geographic Solutions -- developing attendance zones - Demographic-Economic Estimates & Projections Web meetings Join us in the weekly Web Meetings Every Tuesday: Accessing & Using Demographic-Economic Data Every Thursday: Using GIS Tools & GeoSpatial Analysis School Districts 2022-23 Characteristics Interactive Table .. goto top ... Click on header to sort; click header again to sort other direction. ... Click ShowAll button between queries (resets view/table). ... View additional notes below table. Using the Table • Cell value codes: - 1 indicates that the data are not applicable - 2 indicates that the data are missing - 3 indicates that the data do not meet data quality standards • See column descriptions below. • Click ShowAll button between queries (resets view/table). Column descriptions - Name - St - St1 - LEAID - LoGr - HiGr - ZIP Code - Schools - Teachers - Student Teacher Ratio - Teachers Elem - Teachers Sec - Teachers UG - Total Staff - Total Students - Enrl Male - Enrl Female - Enrl Grade 1-8 - Enrl Grade 9-12 - Enrl Grade PK - Enrl Grade KG - Enrl Grade 1 - Enrl Grade 2 - Enrl Grade 3 - Enrl Grade 4 - Enrl Grade 5 - Enrl Grade 6 - Enrl Grade 7 - Enrl Grade 8 - Enrl Grade 9 - Enrl Grade 10 - Enrl Grade 11 - Enrl Grade 12 - Enrl Grade UG - Enrl AdultEd - Enrl AmerInd - Enrl Asian - Enrl Hispanic - Enrl Black - Enrl White - Enrl NHOPI - Enrl Multirace - Enrl Total Race Support Using these Resources .. goto top Learn more about demographic economic data and related analytical tools. Join us in a web session. Each informal session is focused on a specific topic. The open structure also provides for Q&A and discussion of application issues of interest to participants. ProximityOne User Group Join the ProximityOne User Group to keep up-to-date with new developments relating to geographic-demographic-economic decision-making information resources. Receive updates and access to tools and resources available only to members. Use this form to join the User Group. Additional Information ProximityOne develops geographic-demographic-economic data and analytical tools and helps organizations knit together and use diverse data in a decision-making and analytical framework. We develop custom demographic/economic estimates and projections, develop geographic and geocoded address files, and assist with impact and geospatial analyses. Wide-ranging organizations use our software, data and methodologies to analyze their own data integrated with other data. Contact ProximityOne (888-364-7656) with questions about data covered in this section or to discuss custom estimates, projections or analyses for your areas of interest. |
|
|