
|
|
|
ProximityOne Main Calendar Week at a Glance User Guide DataPaks Feature Overview |
... visual data analytics and geospatial analysis ... easiest to learn and use GIS ... comprehensive geographic-demographic-economic analysis capabilities Welcome! Install CV XE GIS on your Windows computer. .. run CV XE GIS installer .. requires UserID .. join User Group here and explore using GIS with geodemographics View CV XE GIS options & features below Join us in a data analytics web session. .. Data Analytics Web Sessions - every Tuesday .. Scottsdale USD, AZ -- illustrating use of CV XE GIS .. black bold boundary; schools, attendance zones, patterns of economic prosperity by neighborhood, zoom-in to school, viewing streets .. add students and more. 
Start-up View • provided to all users of CV XE GIS • similar to VDA.GIS; less detail 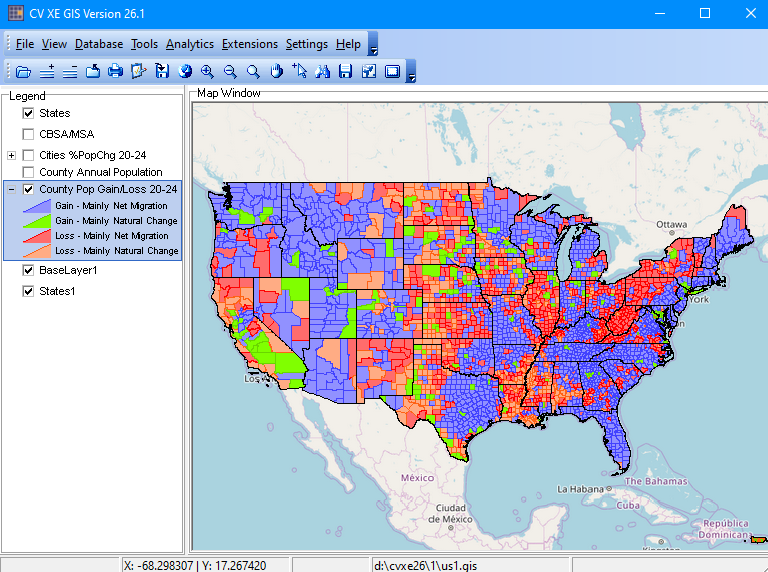 Start using the GeoGateway feature ... - build your custom GIS projects; download and integrate no-fee shapefiles. - focus on one county or city (for example) with related layer drill down to parcels or ZIP codes (for example). .. or one country or state (for example) with related layer continent or multi-country region. - user interface guides you through the steps; no GIS experience required. - create new or add to existing GIS projects. Mapping Statistical Data ... - ready-to-use GIS projects ... immediately available to CV XE GIS users - now includes individual national scope shapefiles with integrated data ... add to your existing projects. Creating Maps & GIS Projects - Create custom maps with drill-down to intersection & census block level. Integrated Visual and Tabular Data Analytics - thematic patterns of median household income by census tract. - click graphic for larger view.  - ready-to-use: included with CVGIS DataPak2. Start viewing/analyzing your data as early as today. Purchase a perpetual use license for the CVGIS Windows Desktop edition. Use this form or call (888.364.7656) to inquire for information about multi-user, enterprise and Web-based editions. Getting Underway with GIS & Data Analytics ... • Things you can do with CV XE GIS • Mapping statistical data - ready-to-use GIS projects and datasets ... immediately available to CV XE GIS users • Certificate in Data Analytics ... discounted fee for CV XE GIS users • Schedule a One-to-One web meeting; get the results that are right for you. • Support & technical assistance by Web, phone and e-mail Order CV XE GIS Resources .. goto top Options and pricing listed below are for Single User. Contact us (888.364.7656) for multi-user/site licensing information. Click link on Item number for more information about topic.
DataPaks -- Annual Updates Click link in left column for additional information. View other data resources and pricing options.
.. The placeholder value shown, 16980, is an example for the Chicago MSA. What You Get -- More About Ordering & Licensing .. goto top • Upon completing your order, you will receive product download instructions. • A one hour One-on-One Getting Started Web session during first month. • All software and data are under a perpetual use, non-transferable license. • Software and datasets may not be distributed. • For orders received after July 1 of the current year, you will receive the current year DataPak and DataPak for following year. • Annual DataPaks are released in January of the reference year 2020 DataPaks become available in January 2020. • Annual DataPaks are full replacement shapefiles. • The DataPak dBase files (also provided in XLS format) may be used with any other software. • The DataPak shapefiles may be used with any other software. • Getting Started support is provided by telephone and e-mail during the first 90 days. DataPak1 • Ready-to-use GIS project integrating these shapefiles/layers: • World base map/topology -- OpenStreetMaps • World by country shapefile • U.S. by state shapefile • U.S. by CBSA/Metro shapefile • U.S. by county shapefile with demographic-economic subject matter DataPak2 -- extended geographic drill-down DataPak1 plus: • U.S. by City/Place shapefile • U.S. by ZIP code area shapefile with demographic-economic subject matter .. or U.S. by Census Tract shapefile with demographic-economic subject matter Contact us about Block Group and Census Block optional add-ons. DataPak3 -- K-12 Schools & School Districts DataPak1 plus: • U.S. by School Districts current year update shapefile with integrated attributes • U.S. by K-12 Public Schools current year update shapefile with integrated attributes Contact us about School Attendance Zones optional add-on. DataPak3A -- K-12 Schools & School Districts & Block Groups & Tracts & Cities/Places DataPak3 plus: • U.S. by Block Groups current year update shapefile with integrated attributes • U.S. by Census Tracts current year update shapefile with integrated attributes • U.S. by Cities/Places current year update shapefile with integrated attributes Contact us about School Attendance Zones optional add-on. DataPak4 -- 119th Congressional Districts & 2024 State Legislative Districts DataPak1 plus: • U.S. by 119th Congressional Districts shapefile with integrated attributes • U.S. by 2024 State Legislative District upper shapefile with integrated attributes • U.S. by 2024 State Legislative District lower shapefile with integrated attributes Contact us about census block to congressional district or state legislative district equivalency data and additional derived data. DataPak5 -- Metro GIS for Specific Metropolitan Areas • See Metros. More About Using CV XE GIS & Continuing Support • CV XE GIS Start-Up • CV XE GIS Applications • CV XE GIS Ready to Use Projects • Using the Digital Map Database • Data Analytics Lab Sessions -- continuing weekly support • Data Analytics User Group ... joining like-minded professionals - exclusively for members: software, data access and application support privileges • About GIS & Data Analytics Support Using these Resources .. goto top Learn more about demographic economic data and related analytical tools. Join us in a Data Analytics Lab Session. There is no fee for these one-hour Web sessions. Each informal session is focused on a specific topic. The open structure also provides for Q&A and discussion of application issues of interest to participants. ProximityOne User Group Join the ProximityOne User Group to keep up to date with new developments relating to geographic-demographic-economic decision-making information resources. Receive updates and access to tools and resources available only to members. Use this form to join the User Group. Additional Information ProximityOne develops geographic-demographic-economic data and analytical tools and helps organizations knit together and use diverse data in a decision-making and analytical framework. We develop custom demographic/economic estimates and projections, develop geographic and geocoded address files, and assist with impact and geospatial analyses. Wide-ranging organizations use our tools (software, data, methodologies) to analyze their own data integrated with other data. Contact ProximityOne (888-364-7656) with questions about data covered in this section or to discuss custom estimates, projections or analyses for your areas of interest. | |||||||||||||||||||||||||||||||||||||||||||||||||||||||||||||||
|
|
