Proximity Home Page


CV XE GIS Main


Decision-Making Information
  ProximityOne
  information resources & solutions
  (888) DMI-SOLN
  (888) 364-7656

Visual analysis with ProximityOne tools
click graphic for info; hover to pause

 
visually analyze clients/markets
site analysis using 1 mile radius

S1

$median household income
patterns by census tract - Houston

hover to pause

113th Congressional Districts

Click for info

US Asian Indian population 2010

Click for info

geocoded students and school
McKinney ISD, TX

Click for info

geocoded students and school
with tax parcels & streets

Click for info

high school attendance zones
with schools by type

Click for info

%high school graduates by
census tract - Puerto Rico

Click for info

Austin, TX MSA counties &
places 10K+ population markers

Click for info

Appalachia counties (green) &
coalfield counties (orange)

Click for info

China provinces percent urban &
cities (markers) by state plan

Click for info

Honolulu census tracts (red)
& census blocks


Central Park area NYC

Click for info

Kansas City Metro & Counties
Home Depot locations (markers)

Click for info

World Cities; focus on Spain

Click for info

CV XE GIS API Gateway

The CV XE GIS APIGateway is a client-server API providing access to wide-ranging geographic-demographic-economic data. Data resources accessible include:

  • ProximityOne Demographic-Economic Estimates and Projections
  • American Community Survey (ACS) 2010, 2011, 2012 -- to block group level
  • Bureau of Economic Analysis quarterly & annual time-series
  • Bureau of Labor Statistics monthly, quarterly & annual time-series
      - Quarterly Census of Employment & Wages; place of work; multiple series; by type of business
      - Local Area Employment & Unemployment; place of residence; multiple series
  • Decennial census: 2010 (SF1, SF2), 2000 (SF1, SF3), 1990 (SF1, SF3) -- to census block level

Data resources are accessed via Internet and include most subject matter and geography for each statistical program. APIGateway users have no cost access to wide-ranging multi-sourced demographic-economic data.

The APIGateway may be used as an integrated component of CV XE GIS or as a standalone application. Use APIGateway to integrate multi-sourced data into custom spreadsheets. Create custom datasets for use by any other software.
  • more information about using CV XE GIS APIGateway
  • install CV XE GIS and start using APIGateway

Contact us for information on accessing extended data of custom API deployments ... or call (888) 364-7656.

Features summarized in this section:
1. Custom Data Extracts -- skip the time and labor intensive dataset downloads
2. Integrated Data Profile -- demographic-economic dashboard
    access integrated demographic-economic data; any county; no-fee, no-registration APIGateway:
    time-series items continuously updated
3. Comparative Analysis Demographic-Economic Profiles

1. Custom Data Extracts
1.1. Using Census 2010 Summary File 1 Census Block Data
  • Skip the downloads! Extract data for specified blocks and subject matter (at item level).
  • Create dbase file for tabular processing and/or integration into shapefile for geospatial analysis.
  • Use CV XE APIGateway to extract census block data from Census 2010 SF1.
  • The no fee version of CV XE APIGateway supports this operation.
  • See overview.

1.2. Custom Data Extracts
Use settings in control panel at left to retrieve data from any program supported. Data are displayed in grid and optionally output to alternative formats/structures. See examples of possibilities and operations: custom datasets.

2. Integrated Data Profile -- demographic-economic dashboard
CV XE uses API (Application Programming Interface) technology to dynamically fetch data updates and make them available in newly generated county/metro profiles. Data presented in the profile vary by time dimension, including decennial, annual, quarterly and monthly. The Integrated Data Profile (IDP) content refreshes/updates monthly.

Subject Matter Updates. Data presented in the IDP update frequently. Example ... as of March 2014, important upcoming data release dates include: county 2013Q3 establishments, employment, wages by industry 2013Q3 data (3/19/14), county January 2014 employment/unemployment estimates (3/21/14), county July 2013 model-based population estimates (3/14) and by age (6/14), metro GDP estimates by industry (9/14), county personal income by major source and sector (REIS: 11/14), county/sub-county ACS 2013 "richer demographics" (12/14). See upcoming events for more information.

2.1. Illustrative County IDPs ... scroll section
Arizona
  • Maricopa County (Phoenix metro)
California
  • Los Angeles County (Los Angeles, CA metro)
  • Santa Clara County (San Jose, CA metro)
Georgia
  • Fulton County (Atlanta metro)
Hawaii
  • Honolulu County (Honolulu metro)
Iowa
  • Warren County (Des Moines metro)
Kansas
  • Allen County
  • Johnson County (Kansas City metro)
Maryland
  • Montgomery County (Washington, DC metro)
Missouri
  • Cole County (Jefferson City metro)
  • Jackson County (Kansas City metro)
  • Jasper County (Joplin metro)
  • Newton County (Joplin metro)
New York
  • Albany County (Albany, NY metro)
  • Chemung County (Elmira, NY metro)
  • Oneida County (Rome-Utica metro)
  • Westchester County (New York, NY metro)
North Carolina
  • Mecklenburg County (Charlotte, NC metro)
Texas
  • Ector County (Odessa, TX metro)
  • Harris County (Houston metro) -- all industry sectors
  • Harris County; CEW industry sector: natural resources and mining
  • Harris County; CEW industry sector: manufacturing
  • Harris County; CEW industry sector: information services


2.2. Creating IDP Reports -- Using the APIGateway IDP -- scroll section
How to Run Reports -- Using CV XE APIGateway
  • Install CV XE software on Windows computer with Internet access.
  • Use latest version of CV XE.
  • After installing, start CV XE software: c:\cvxe\cvxe.exe or desktop icon.
  • With CV XE running, choose File>APIGateway (top menu bar, far left).
  • APIGateway window opens. Dbl-click Honolulu (lower left listbox).
      ... profile appears in grid.
  • Get county of interest ... select a county of interest (lower left listbox) and click run;
      ... wait until status bar shows "Complete".
  • Profile appears in grid; optionally export to HTML.

The graphic shown below illustrates use of APIGateway integrating data from multiple Bureau of Economic Analysis, Census Bureau and Bureau of Labor Statistics (BLS) programs. This Integrated Data Profile has been generated by double-clicking the county/item of interest in the listbox at left of the grid. The grid shows results of the data queries for Honolulu County, HI. Several tables are displayed. At the top are population by race and Hispanic population by race. The data are presented in columns corresponding to Census 2000 (SF1), ACS 2010 5 year data (estimates centric to mid-2008), ACS 2011 5 year data (estimates centric to mid-2009) and Census 2010 (SF1). Multiple additional BLS-sourced time-series characterize the labor force. Click a link on the time-series item to view chart time line and additional options. Optionally export the grid display by clicking the Export button.


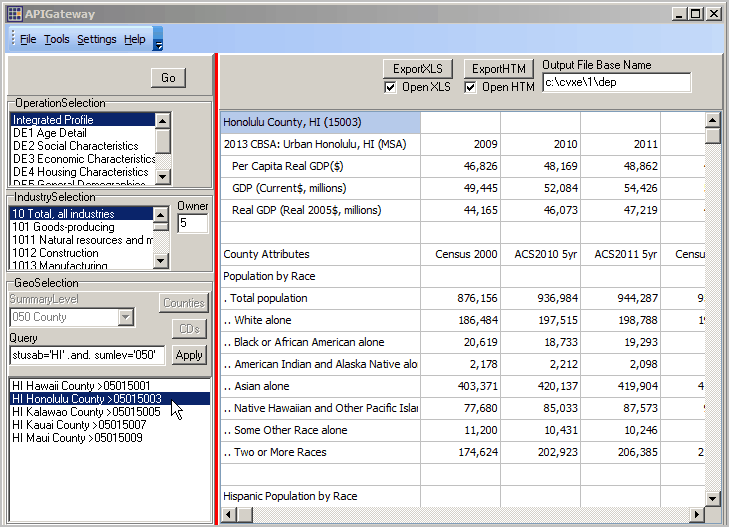
CV XE GIS API Integrated Profile -- scroll section showing sample profile exported as HTML
  • data from Census 2000, ACS 2010, ACS 2011, Census 2010, post-Census 2010 estimates, selected labor force characteristics series
  • displayed as columns in grid
  • display this type of profile for any county
  • scroll down & click on monthly unemployment series ID (HTML link); view monthly trend line chart & more
      - select a different type of business & re-display profile
  • exportable to HTML and/or XLS
  • data automatically update monthly
  • other examples (using manufacturing sector establishment, employment, payroll series):       ... Harris County, TX (Houston)
Honolulu County, HI (15003)Census 2000ACS2010 5yrACS2011 5yrCensus 2010ACS2012 5yr7.1.10 Estimate7.1.11 Estimate7.1.12 Estimate          
Population by Race                          
. Total population 876,156 936,984 944,287 953,207... 956,481 966,363 976,372          
.. White alone 186,484 197,515 198,788 198,732... 205,295 211,597 219,187          
.. Black or African American alone 20,619 18,733 19,293 19,256... 20,048 23,590 26,894          
.. American Indian and Alaska Native alone 2,178 2,212 2,098 2,438... 2,859 3,061 3,271          
.. Asian alone 403,371 420,137 419,904 418,410... 425,664 424,186 422,319          
.. Native Hawaiian and Other Pacific Islander alone 77,680 85,033 87,573 90,878... 93,045 93,360 93,362          
.. Some Other Race alone 11,200 10,431 10,246 10,457............          
.. Two or More Races 174,624 202,923 206,385 213,036... 209,570 210,569 211,339          
                         
Hispanic Population by Race                          
. Hispanic, Total 58,729 74,077 76,360 77,433   77,889 82,033 85,789          
.. Hispanic - White alone 10,851 16,411 17,391 17,048   23,611 26,615 29,818          
.. Hispanic - Black alone 1,036 1,272 1,272 1,327   2,122 2,393 2,618          
.. Hispanic - AIAN alone 604 893 864 739   1,161 1,206 1,293          
.. Hispanic - Asian alone 6,840 9,900 10,043 8,391   11,175 11,260 11,235          
.. Hispanic - NHPI alone 3,250 3,415 3,551 4,643   5,829 5,887 5,865          
.. Hispanic - Some Other Race alone 9,667 9,342 9,133 9,170   .........          
.. Hispanic - Two or More Races 26,481 32,844 34,106 36,115   33,991 34,672 34,960          
                         
Population by Age 876,156 936,984 944,287 953,207   956,481 966,363 976,372          
.. 0- 4 years 56,849 61,178 61,582 61,261   61,374 62,607 62,725          
.. 5- 9 years 60,425 54,964 55,332 57,818   57,943 58,097 58,762          
.. 10-14 years 57,574 56,991 57,212 56,147   56,359 55,938 55,433          
.. 15-19 years 57,176 60,252 60,022 60,344   60,298 58,628 56,926          
.. 20-24 years 65,376 72,487 72,312 73,203   73,007 76,677 80,069          
.. 25-29 years 64,744 70,689 71,788 71,667   71,674 74,791 78,109          
.. 30-34 years 65,880 60,652 61,725 62,779   63,003 65,630 68,444          
.. 35-39 years 70,573 62,173 61,219 61,956   61,928 60,720 60,732          
.. 40-44 years 66,705 65,169 64,790 63,340   63,657 63,461 63,347          
.. 45-49 years 61,357 66,083 65,853 66,376   66,392 65,031 63,124          
.. 50-54 years 55,882 64,229 64,647 65,348   65,780 65,022 64,069          
.. 55-59 years 42,705 57,539 58,540 60,387   60,888 61,308 61,709          
.. 60-64 years 33,173 51,172 53,166 54,091   54,852 55,820 55,496          
.. 65-69 years 31,325 36,491 38,288 39,927   40,139 41,875 44,604          
.. 70-74 years 31,149 28,728 28,825 29,000   29,127 29,835 30,902          
.. 75-79 years 26,072 26,562 26,409 25,223   25,230 24,755 24,360          
.. 80-84 years 16,432 21,511 21,583 21,980   22,146 22,067 21,988          
.. 85 years or more 12,759 20,114 20,994 22,360   22,684 24,101 25,573          
                         
Civilian Labor Force   462,843 467,105 ...                  
.. Male   239,511 240,930 ...                  
.. Female   223,332 226,175 ...                  
                         
Median Household Income ($)   70,093 71,263 ...                  
                         
BLS QCEW Industry: 10 Owner: 5                          
10 Total, all industries JanFebMarAprMayJunJulAugSepOctNovDecAnnual
.. Employment 2010 330,337 331,859 332,769 332,332 333,580 333,244 333,504 334,252 336,421 337,390 339,073 343,119 334,823
.. Employment 2011 333,946 337,321 339,394 337,089 337,308 337,912 339,134 340,551 342,788 342,413 345,959 348,923 340,228
.. Employment 2012 340,575 342,277 343,343 344,171 346,603 347,315 347,357 349,492 350,081 350,334 354,551 356,692 347,733
.. Employment 2013                          
                         
10 Total, all industries Q1Q2Q3Q4Annual                
.. Establishments 2010 23,626 23,772 23,847 24,059 23,826                
.. Establishments 2011 23,516 23,568 23,708 23,914 23,677                
.. Establishments 2012 23,632 23,825 24,104 24,251 23,953                
.. Establishments 2013                          
                         
10 Total, all industries Q1Q2Q3Q4Annual                
.. Total Wages ($000) 2010 3,250,381 3,287,284 3,409,276 3,806,389 13,753,330                
.. Total Wages ($000) 2011 3,417,189 3,392,536 3,606,634 3,792,213 14,208,572                
.. Total Wages ($000) 2012 3,645,174 3,594,108 3,636,150 4,049,818 14,925,250                
.. Total Wages ($000) 2013                          
                         
10 Total, all industries Q1Q2Q3Q4Annual                
.. Average Weekly Wages ($) 2010 754 759 783 862 790                
.. Average Weekly Wages ($) 2011 780 773 814 844 803                
.. Average Weekly Wages ($) 2012 820 799 801 880 825                
.. Average Weekly Wages ($) 2013                          
                         
BLS LAU                          
Labor Force: LAUPS15007006JanFebMarAprMayJunJulAugSepOctNovDecAnnual
.. Labor Force 2011 456,974 460,181 462,269 462,544 460,293 460,735 460,550 455,449 457,815 457,917 461,272 459,924 459,660
.. Labor Force 2012 460,756 461,222 461,504 459,141 458,613 456,981 456,007 452,289 455,221 455,822 458,457 459,870 457,990
.. Labor Force 2013 456,079 458,213 452,963 454,836 456,289 456,775 449,705............
                         
BLS LAU                          
Employment: LAUPS15007005JanFebMarAprMayJunJulAugSepOctNovDecAnnual
.. Employment 2011 431,326 435,397 438,244 439,413 435,733 432,572 433,564 428,988 430,605 431,656 435,310 436,068 434,073
.. Employment 2012 435,238 436,222 436,401 435,909 434,503 429,653 430,994 429,145 432,633 433,835 437,165 440,370 434,339
.. Employment 2013 434,245 437,483 433,031 437,070 438,098 435,507 430,809............
                         
BLS LAU                          
Unemployment: LAUPS15007004JanFebMarAprMayJunJulAugSepOctNovDecAnnual
.. Unemployment 2011 25,648 24,784 24,025 23,131 24,560 28,163 26,986 26,461 27,210 26,261 25,962 23,856 25,587
.. Unemployment 2012 25,518 25,000 25,103 23,232 24,110 27,328 25,013 23,144 22,588 21,987 21,292 19,500 23,651
.. Unemployment 2013 21,834 20,730 19,932 17,766 18,191 21,268 18,896............
                         
BLS LAU                          
Unemployment Rate: LAUPS15007003JanFebMarAprMayJunJulAugSepOctNovDecAnnual
.. Unemployment rate 2011 5.6 5.4 5.2 5.0 5.3 6.1 5.9 5.8 5.9 5.7 5.6 5.2 5.6
.. Unemployment rate 2012 5.5 5.4 5.4 5.1 5.3 6.0 5.5 5.1 5.0 4.8 4.6 4.2 5.2
.. Unemployment rate 2013 4.8 4.5 4.4 3.9 4.0 4.7 4.2............
                         
Notes                          
"..." data not available for this item                          
Usage, Structure and Sources                          
Developed using CV XE GIS APIGateway                          
Additional Information: (888)364-7656                          


3. Comparative Analysis Demographic-Economic Profiles -- scroll section
This scroll section reviews use of the APIGateway to generate DE2-DE5 Demographic-Economic profiles.
Illustrative user interface to create a DE2 Social Characteristics profile for a metropolitan area.
See examples of full displays below graphic.


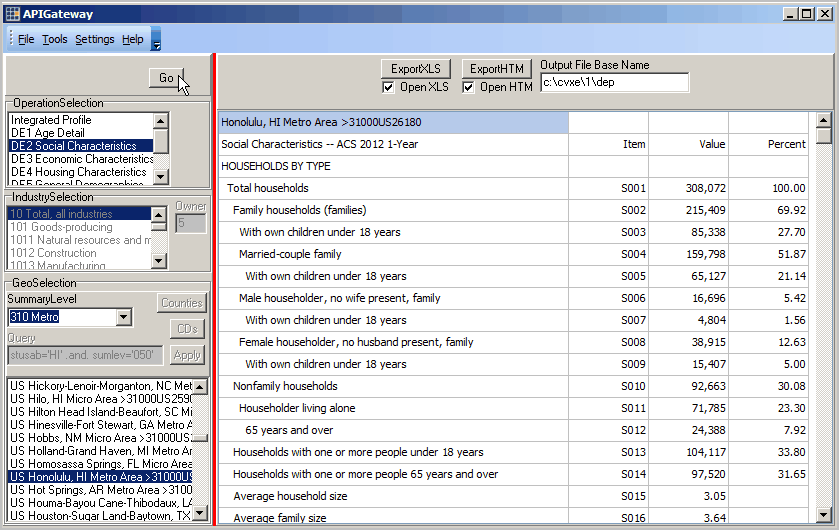
Full sample views of profiles (saved to HTML):
DE2 Social Characteristics -- example: Houston, TX MSA DP2
DE3 Economic Characteristics -- example: Houston, TX MSA DP3
DE4 Housing Characteristics -- example: Houston, TX MSA DP4
DE5 General Demographics -- example: Houston, TX MSA DP5


Additional Information
ProximityOne develops geographic-demographic-economic data and analytical tools and helps organizations knit together and use diverse data in a decision-making and analytical framework. We develop custom demographic/economic estimates and projections, develop geographic and geocoded address files, and assist with impact and geospatial analyses. Wide-ranging organizations use our tools (software, data, methodologies) to analyze their own data integrated with other data. Follow ProximityOne on Twitter at www.twitter.com/proximityone. Contact ProximityOne (888-364-7656) with questions about data covered in this section or to discuss custom estimates, projections or analyses for your areas of interest.


Copyright © . ProximityOne. All Rights Reserved.
Sitemap | Contact Us | News