
|
|
GIS Solutions - CV XE GIS - VDA Desktop - VDA Web GIS DemographicEconomic Data Explorer Related Sections - States - Congressional Districts - Congressional Communities - School Districts - Counties - Cities/Places - TractsNeighborhoods - Block Groups - Census Blocks - ZIP Codes - Urban Areas |
Census 2010 Census Block GeoDemographic resources include census block shapefiles for mapping and geospatial analysis, census block demographic datasets and shapefiles with integrated demographics. There are more than 11 million Census 2010 census blocks covering the U.S. wall-to-wall. Census blocks are the smallest geographic areas for which decennial census data are tabulated and are the smallest/lowest-level building blocks for most other Census legal and statistical area geography. Mapping Urban/Rural Patterns by Census Block ... using TIGER/Line shapefiles and Census 2010 demographics & GIS applications ... see http://proximityone.com/mapping_census_blocks.htm 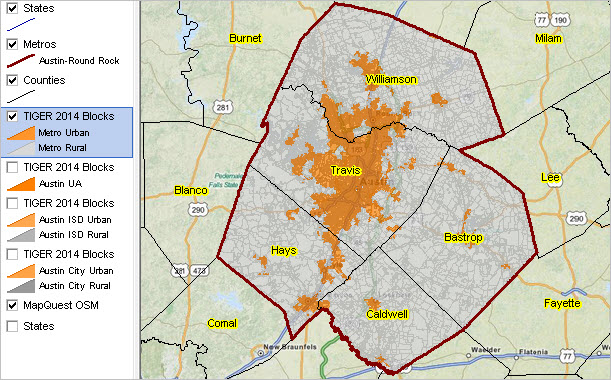 Census 2010 Census Block Tallies by State ... interactive table: http://proximityone.com/geo_blocks.htm ... water and land area blocks; compare with tracts and block groups ... Warren Glimpse blog on this topic ... searchable list of blog posts Looking at this geographic level allows you to examine custom-defined areas (Washington DC example) and visually convey insights to your team/clients. Access/analyze these data using the ProximityOne CV XE GIS or your own software. Washington, DC; census blocks in context of OpenStreetMaps 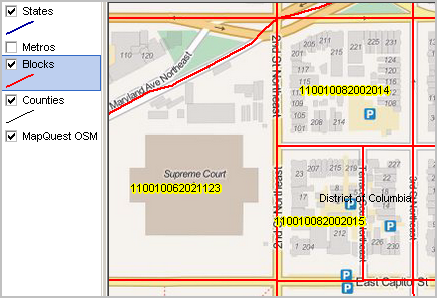 See more views and related GIS/mapping details.
Census blocks are normally bounded by roads and rails where possible. Generally permanent from census to census,
census blocks are given a unique identifier comprised of state code(2) + county code(3) + tract code(6) + block code(4).
See examples in above view where census blocks are labeled with their GEOID/geocode.
Census Block Geographic & Demographic Resources -- scroll section
Census Block Shapefiles
• Using census block geodemographics: Census 2010 & 2016 updates • 11.6 million blocks comprising 12.2 GB available in ready-to-use structure; download/DVD. • 1) complete shapefiles, 2) database component only, 3) optional integrated demographics. • See more about http://proximityone.com/tiger2016_blocks.htm. New York City Census Block Demographics • See more about NYC census block demographics. • New York had 350,169 census blocks in Census 2010 with an average population of 55. Using Census 2010 Summary File 1 Census Block Data • Skip the downloads! Extract data for specified blocks and subject matter (at item level). • Create dbase file for tabular processing and/or integration into shapefile for geospatial analysis. • Use CV XE APIGateway to extract census block data from Census 2010 SF1. • See overview. Census Block, Block Group & Census Tract Pattern Analysis • Join us in this upcoming one-hour Web session. • More information. Register (no fee). Census 2010 Census Block Shapefiles -- downloadable examples & applications - access provided by CV XE GeoGateway - latest vintage from TIGER 2013 (August 2013). Census 2010 Census Block Demographics Options - Demographic Profile -- downloadable examples & applications
- ProximityOne developed datasets derived from
Census 2010 Summary File 1
- Census 2010 P.L. 94-171 Extract -- downloadable examples & applications- block level data similar in scope to Census 2010 Demographic Profile Summary File (developed by Census for census tracts and larger areas -- not blocks).
- ProximityOne developed datasets derived from
Census 2010 P.L. 94-171 (Redistricting) File
- Census 2010 Summary File 1 (SF1)- data at block level only which can work directly with block shapefiles.
- a broader set of subject matter than provided by Demographic Profile or P.L. 94-171 described above.
- Census 2010 Summary File 1 -- via CV_APIGateway- this is the most comprehensive set of subject matter available at the census block level; downloadable datasets.
- same scope of subject matter as described for SF1 above, but accessed by item/item set using API technology.
Urban/rural demographic patterns by census block - http://proximityone.com/cdgallery/guide/index.htm?ur_census_block.htm Equivalence files developed using census blocks - ZIP Code Demographics by City/Place: http://proximityone.com/zip-place.htm - ZIP Code Demographics by School District: http://proximityone.com/zip-sd.htm - ZIP Code Demographics by Congressional District: http://proximityone.com/zip-cd.htm Using census block geodemographics mapping & geospatial analysis: - Houston, TX MSA (section 3) - Texas Statewide - Santa Clara County, CA Census Block Application Areas -- scroll section
Census block data meet a wide range of reference, planning,
analysis, and data linkage needs. Selected topics are covered below.
Legislative Districts. While 2010 census blocks will generally retain the same code/ID and scope of geography until 2020 (there are some that have changed resulting from post-Census 2010 census tract reorganization), the initial Census 2010 Summary File 1 (SF1) tabulations reflected the 112th Congressional Districts (CDs) and corresponding pre-redistricting state legislative districts (SLDs). To equivalence Census 2010 census blocks to the 113th CDs and post-redistricted SLDs requires use of the 113th CD SF1 released in 2013. The 113th SF1 geographic segment provides the required crosswalk codes. Market Size/Composition. Use these maximum geographic granularity demographic data to target your marketing, sales, operations, logistics, and related customer/market-oriented needs. Schools & School Districts. By using census blocks (better yet block groups) to define school service areas or attendance zones will make it easier to use Census 2010 and American Community Survey (ACS) annual demographics to examine characteristics of those areas. School districts are defined as a set of census blocks. For districts that change boundary after the 2009-2010 school year (date for school district boundary data in Census 2010 references), you can tabulate the size and characteristics of the new district configuration and assess implication since changes from previous boundaries -- by using census block geodemographics. NTIA Broadband Initiative. Census block level data are of critical importance to the U.S. National Telecommunications and Information Administration (NTIA) broadband availability enhancement. Only using the 2010 census block data can broadband providers accurately assess broadband availability by urban/rural geography. Civil Rights Issues. The single year of age detail, by gender, in the SF1 database provide an easily accessible database useful in wide ranging applications involving civil rights cases. It becomes a relatively straightforward application to determine the demographic size and composition of any study area. Health. The Census 2010 data are used in many application areas as "denominator" data. That is, by knowing the size of the population or housing served, health analysts can better examine the implications of magnitude associate with health-related measures that are often difficult to measure directly. Areas subject to analysis for health-related reasons are sometimes defined in a fluid manner making the block level granularity ideal to develop denominator data for health cachement areas. Environment. The impact of pollutants along a stream or coastal area can often be measured in terms of toxicity to the geographic area exposed. The census block data enable analysts to examine the size of particular types of population adjacent to environmental impact sites. Disaster Planning. The SF1 data provide a unique way to be able to determine the impact of any type of disaster with near pin-point accuracy -- and dynamically. Urban & Rural. Each census block is classified as urban or rural. The census block is the smallest urban area geographic area. Groups of urban blocks are used to define urban clusters and urbanized areas. The initial Census 2010 SF1 did not provide an urban-rural indicator at the block level. Use the 2013 Census 2010 113th CD SF1 and 2013 TIGER/Line block shapefiles files to identify blocks as urban or rural. Aggregate Block Data. Summary or aggregate data can be developed for study areas based radii, corridors, or geographic correspondence of block within an area. Aggregate the Census 2010 demographics contained in the data record to your target geography. The data record contains the latitude-longitude as well as the full sequence of geocodes to enable these types of data aggregation. Geographic Relationships. Determine, for example, what ZIP code areas are partly/wholly contained with a city, metropolitan area, county, custom study area, or many other types of geography. Use the block correspondence list to enable your software to aggregate non-census data to block or any of these other areas. Equivalencing Census 2000 with Census 2010 Census Blocks Census 2000 census blocks compared to Census 2010 census blocks often differ in terms of geographic area covered and/or census block codes. What was Census 2000 block 1007 in tract 4124.00 (aka 4124 aka 412400) in Harris County, Texas is subdivided into several blocks for Census 2010. See these relationships by map view and tabularly in the Census 2000 - Census 2010 Census Block Relationships Gallery views. The Census 2000-Census 2010 census block equivalence file can be used to examine these differences. Fields included in this file are listed in the following scroll section.
Support Using these Resources Learn more about demographic economic data and related analytical tools. Join us in a Data Analytics Lab session. There is no fee for these Web sessions. Each informal session is focused on a specific topic. The open structure also provides for Q&A and discussion of application issues of interest to participants. ProximityOne User Group Join the ProximityOne User Group to keep up-to-date with new developments relating to geographic-demographic-economic decision-making information resources. Receive updates and access to tools and resources available only to members. Use this form to join the User Group. Additional Information ProximityOne develops geographic-demographic-economic data and analytical tools and helps organizations knit together and use diverse data in a decision-making and analytical framework. We develop custom demographic/economic estimates and projections, develop geographic and geocoded address files, and assist with impact and geospatial analyses. Wide-ranging organizations use our software, data and methodologies to analyze their own data integrated with other data. Contact ProximityOne (888-364-7656) with questions about data covered in this section or to discuss custom estimates, projections or analyses for your areas of interest. |
|
|