Houston Metro Area

Contents
Section 1 -- illustrates use of Proximity information resources to view/analyze schools and school districts.
Section 2 -- illustrates use of Proximity analysis tools to view/analyze county demographic patterns 2000-2020.
Section 3 -- illustrates examples of thematic mapping at the census block level.
Houston Metro refers to the Houston-Baytown-Sugar Land, TX MSA
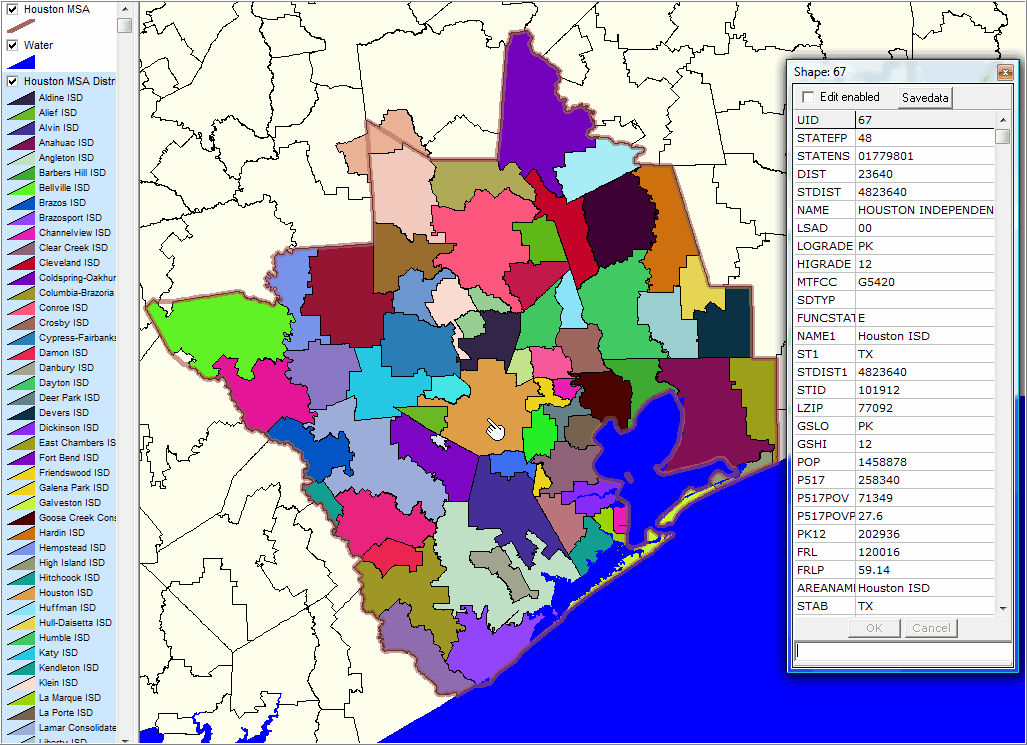
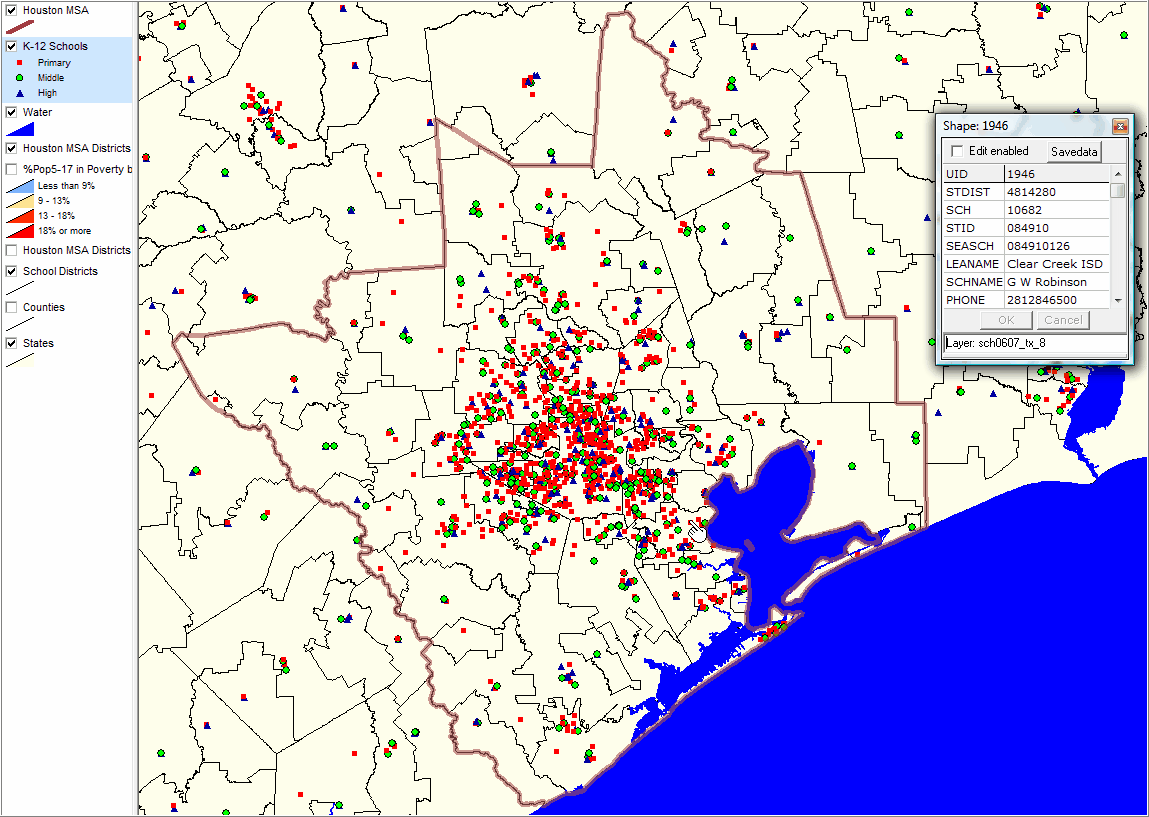
1. Houston Metro: School District GeoDemographics
|
|
|
|
|
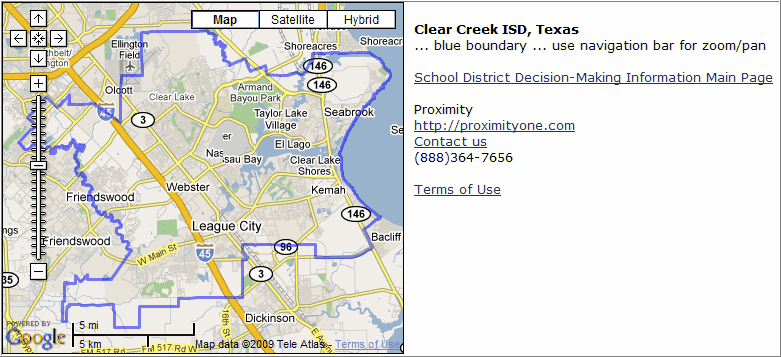
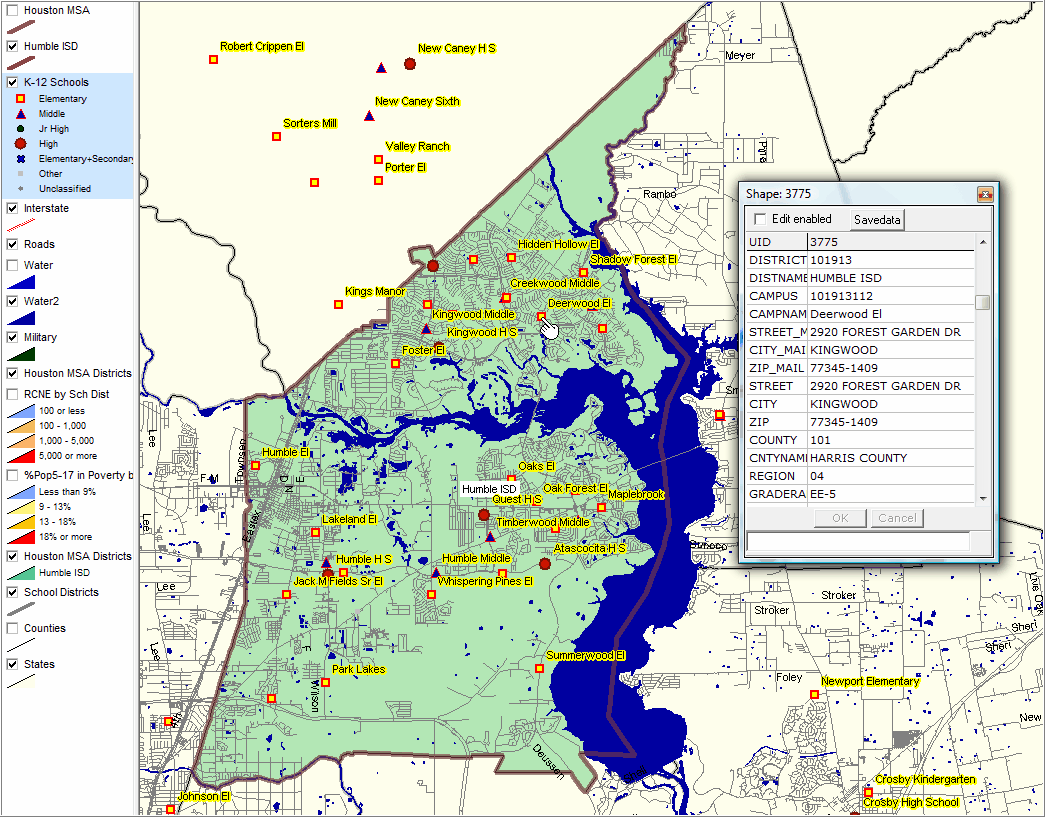
Zoom-in to Clear Creek ISD. See pointer location in previous view for location of this district. Illustrates knitting together roads, schools and other detailed attributes. Schools locations depicted by different marker styles (see legend) showing grade group. Identify tool used to show mini-profile of selected school (see pointer/hand).
|

|
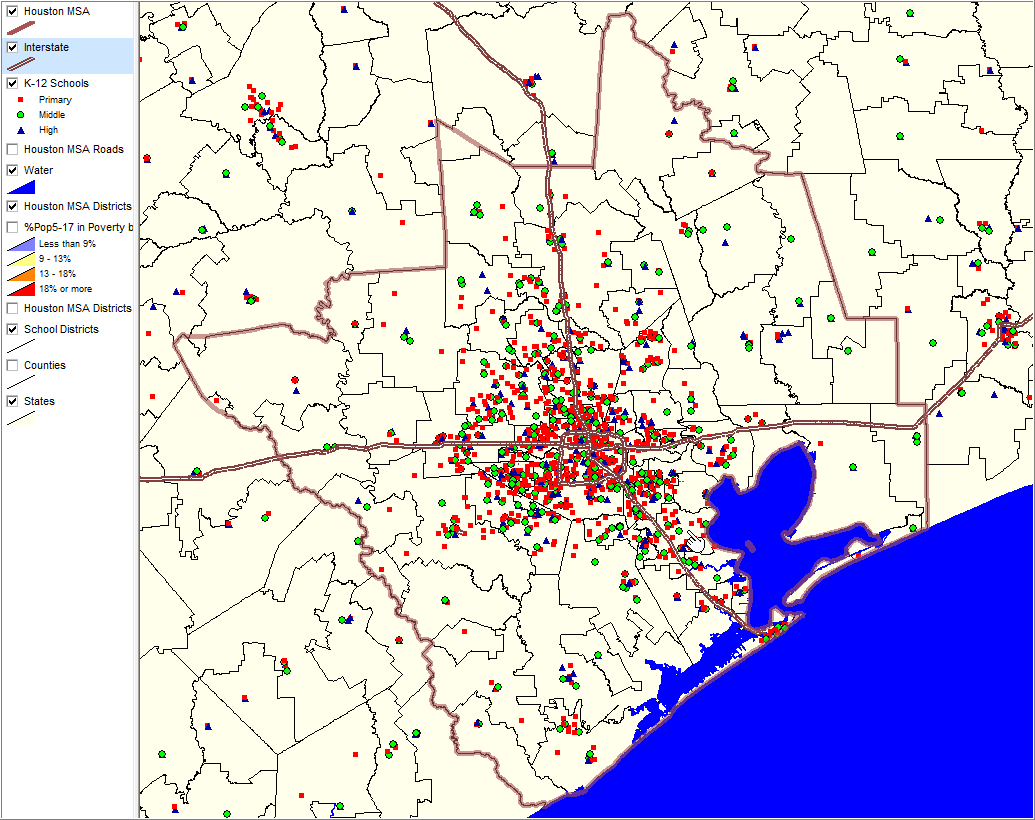
Illustrates knitting together roads, schools and other detailed attributes. Schools locations depicted by different marker styles (see legend) showing grade group. Identify tool used to show mini-profile of selected school (see pointer/hand).
|
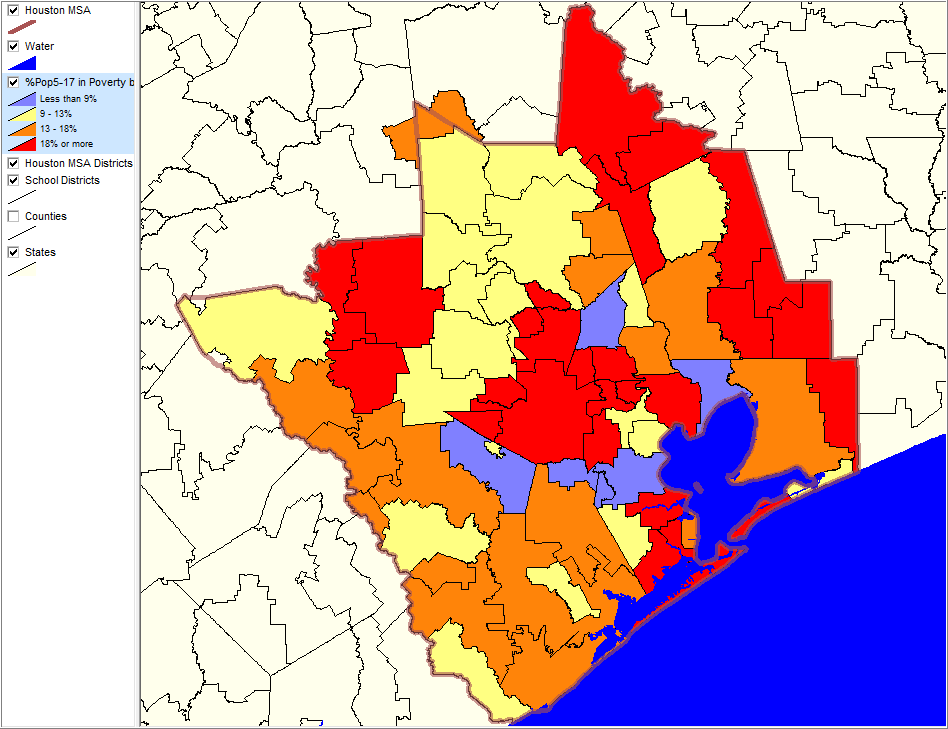
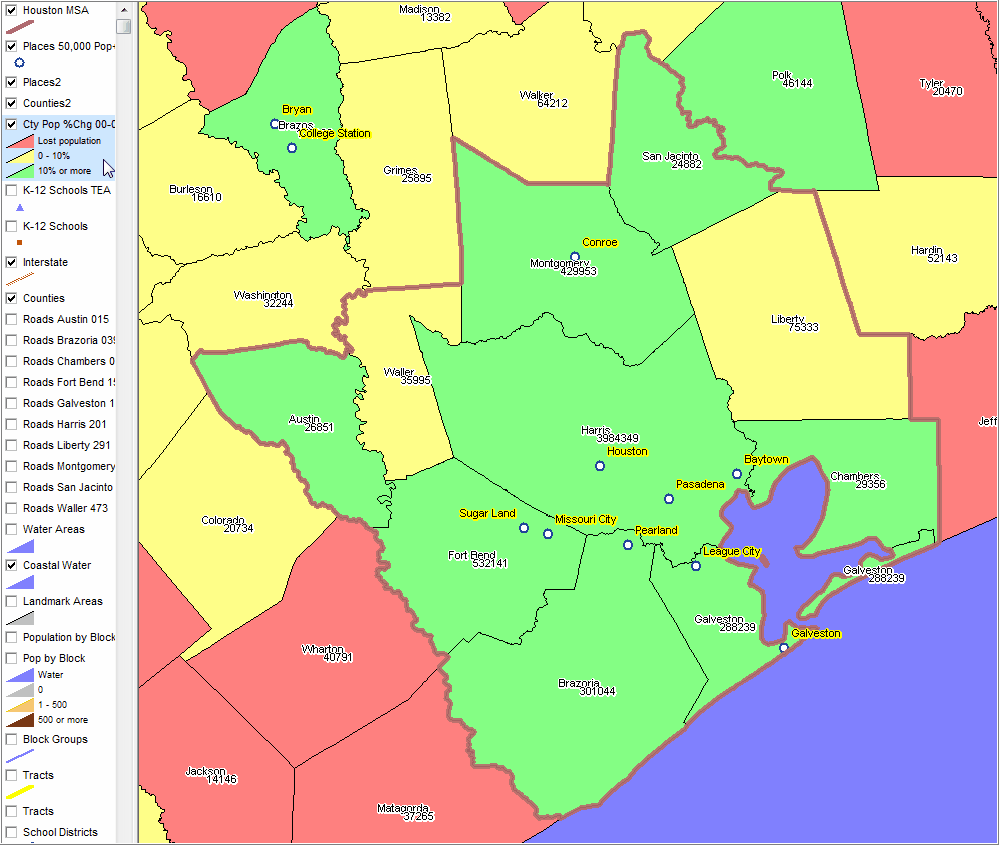
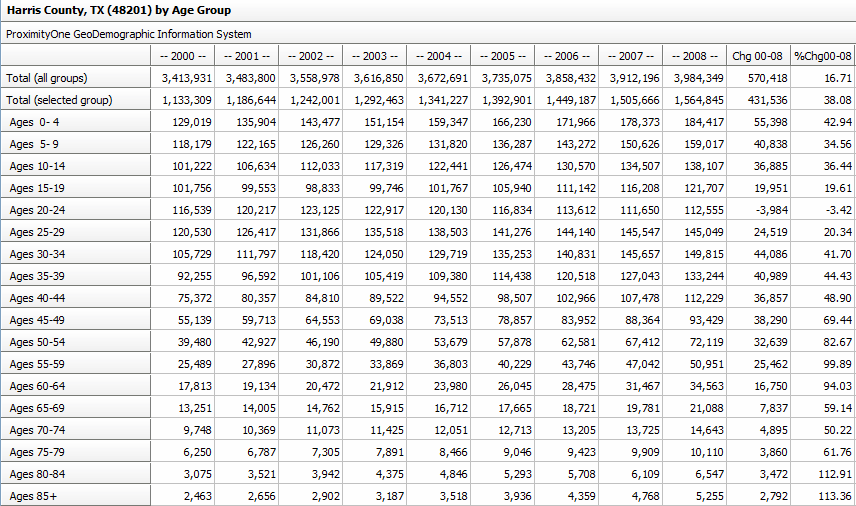
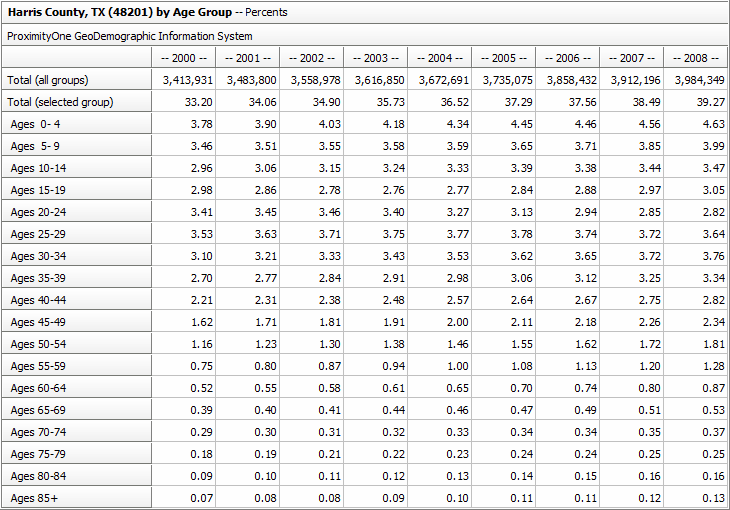
2. Houston Metro Region: County Demographic Composition & Trends
Counties shown with white name labels with population displayed below name. Places 50,000 population and over (2007) shown as markers with yellow labels.
|
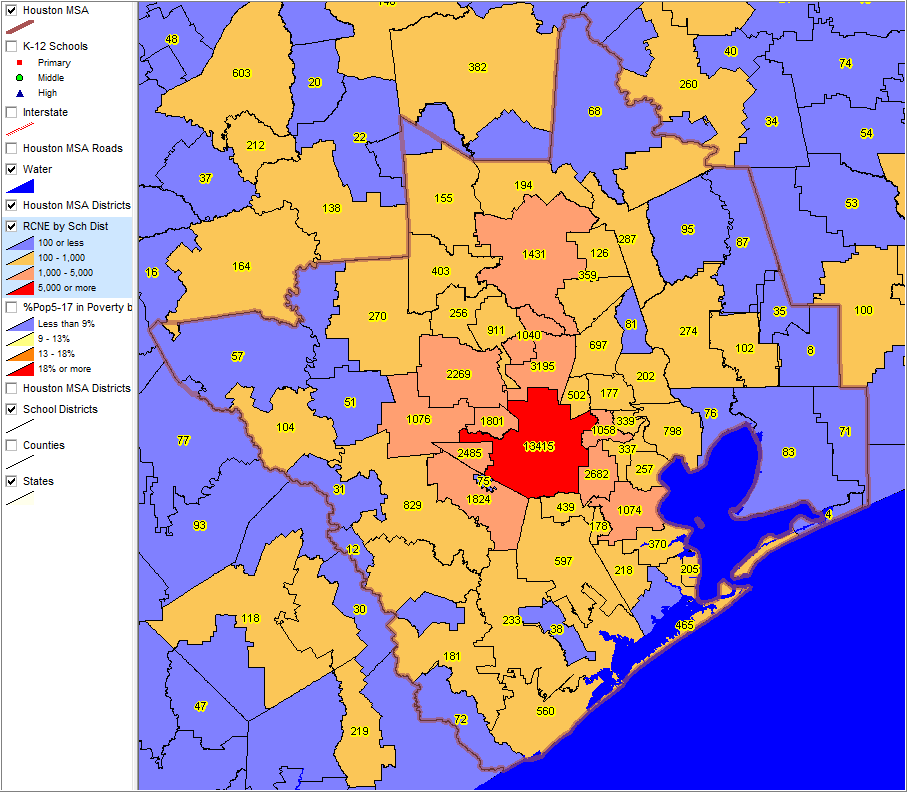
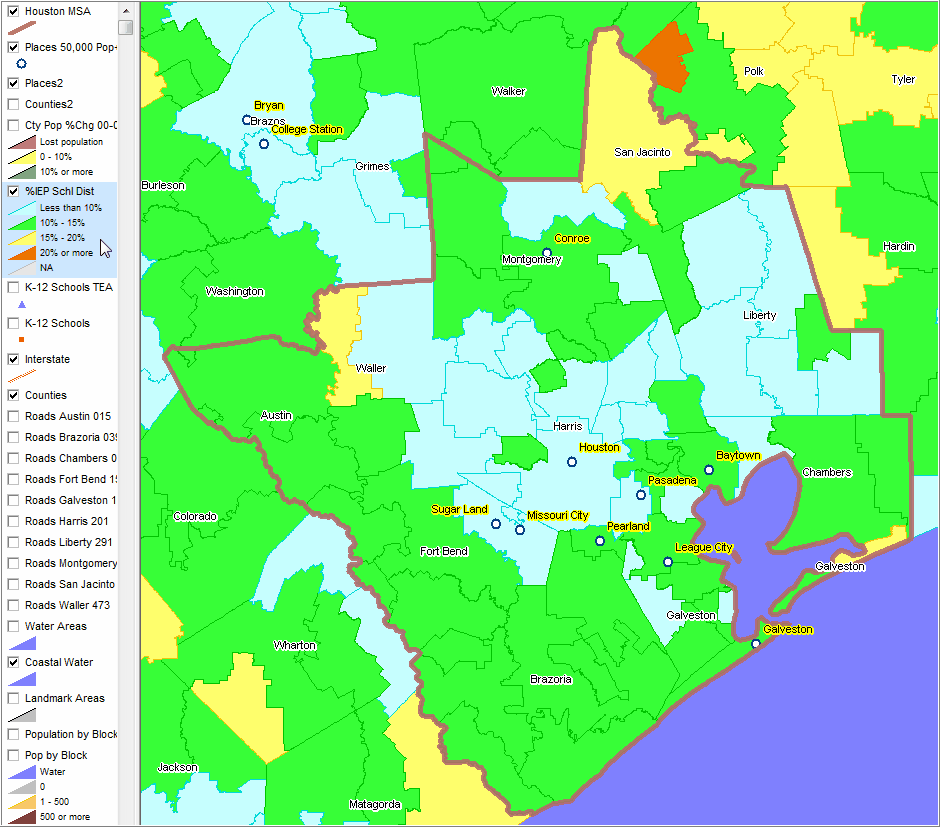
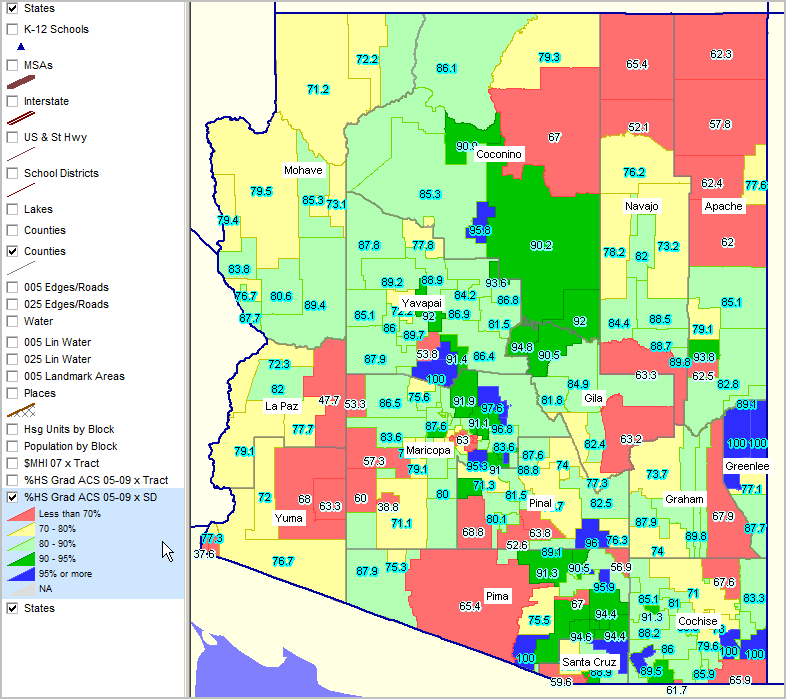
Patterns of percent students who have an Individual Education Program (IEP) 2006-07 school year
|
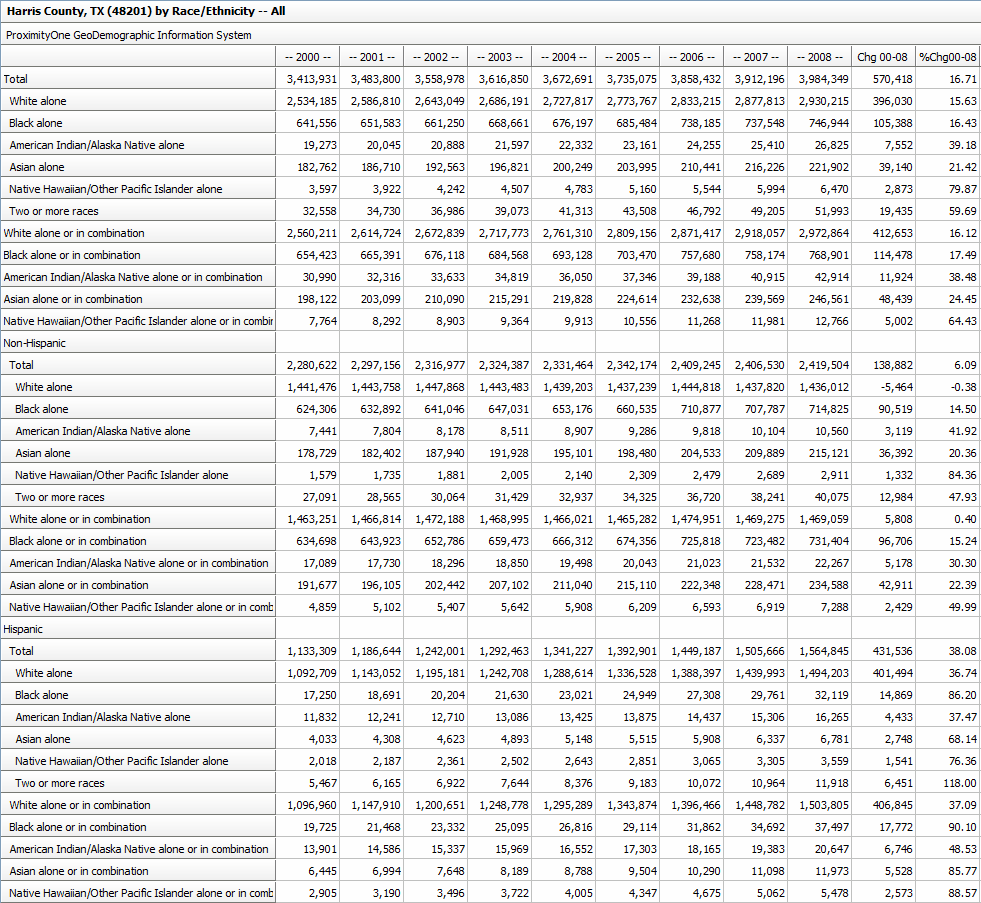
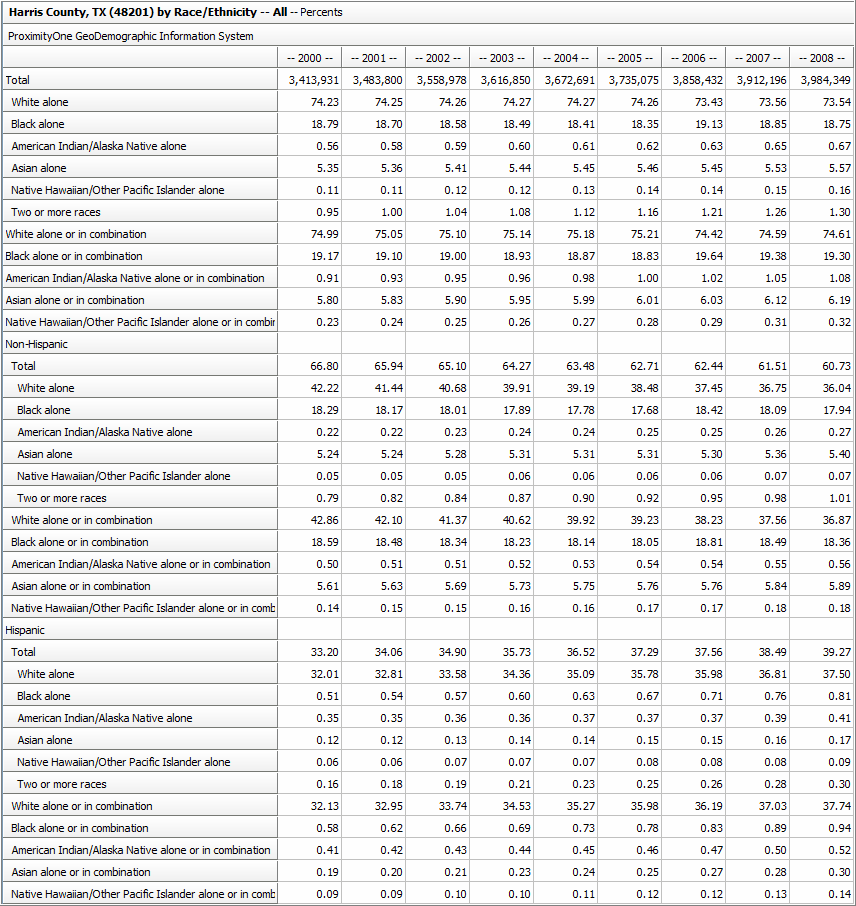
County/Region Demographic Composition/Trend Analysis
Proximity develops annual estimates and projections of subject matter items shown in these tables to 2020 under alternative scenarios. These data may be linked with CV thematic mapping/geospatial analysis and/or exported for use with other software (e.g. Excel) as well as in HTML/RTF formats for publishing in other documents.
|
|
|
|
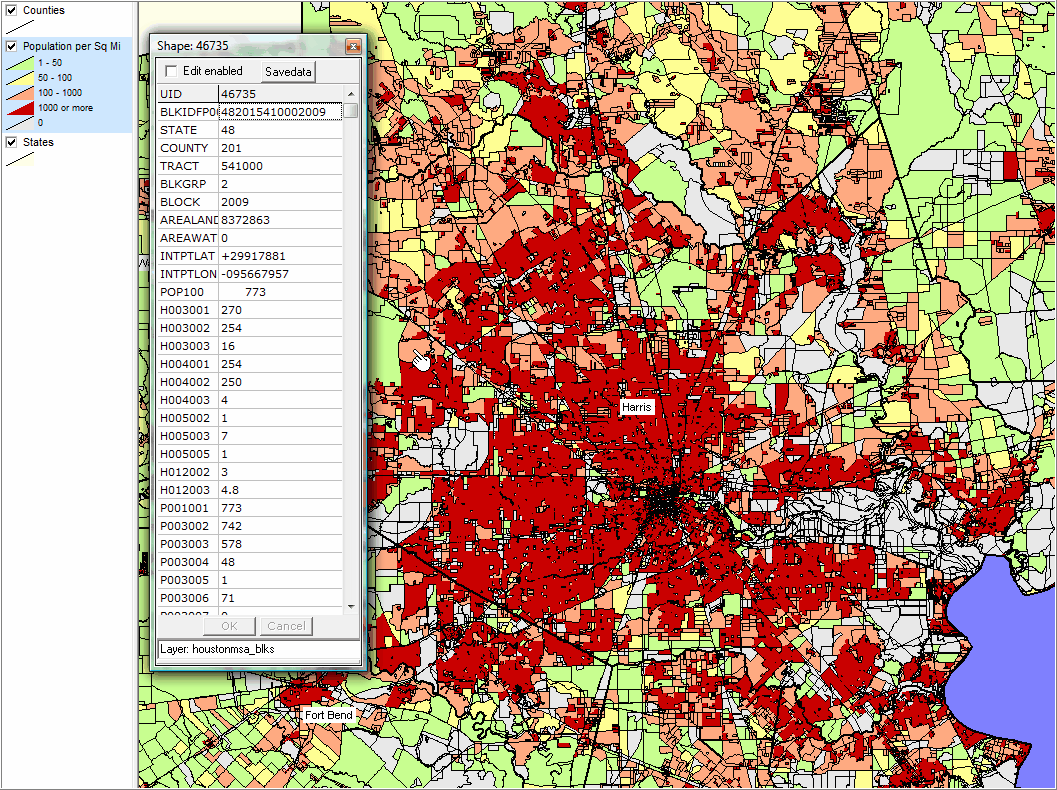
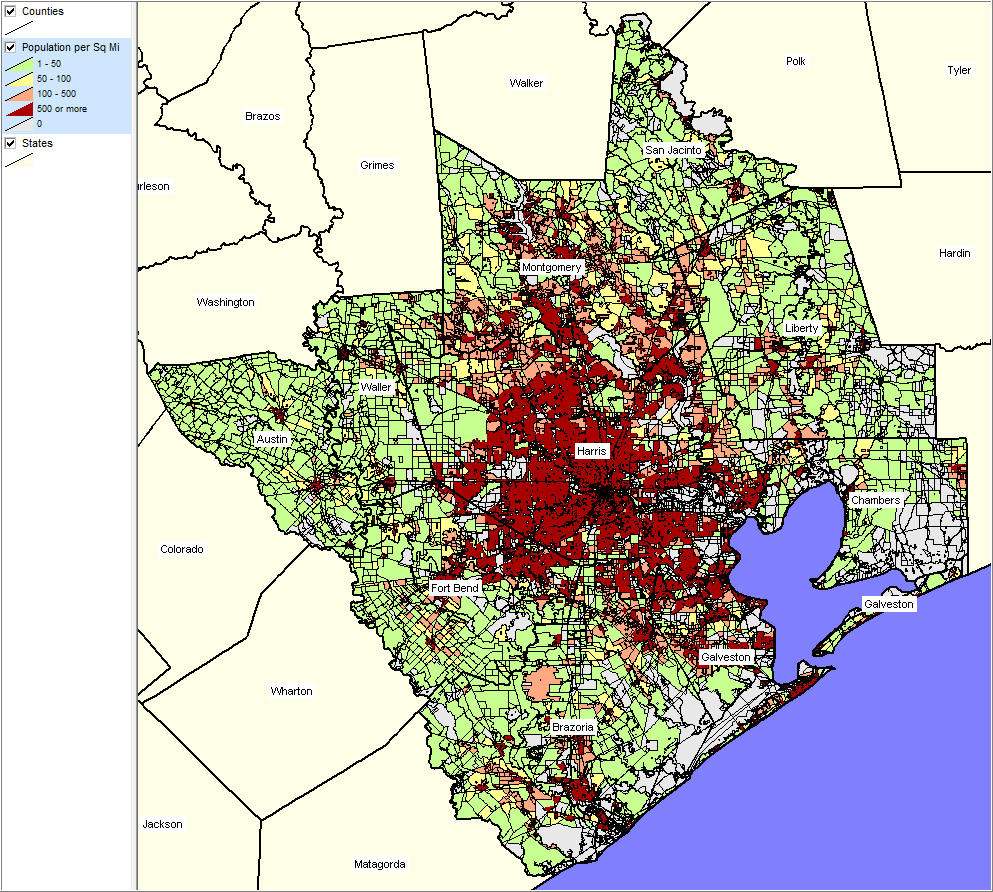
3. Houston Metro by Census Block
View developed using the Proximity C2KBLK database -- http://proximityone.com/c2kblk.htm.
|
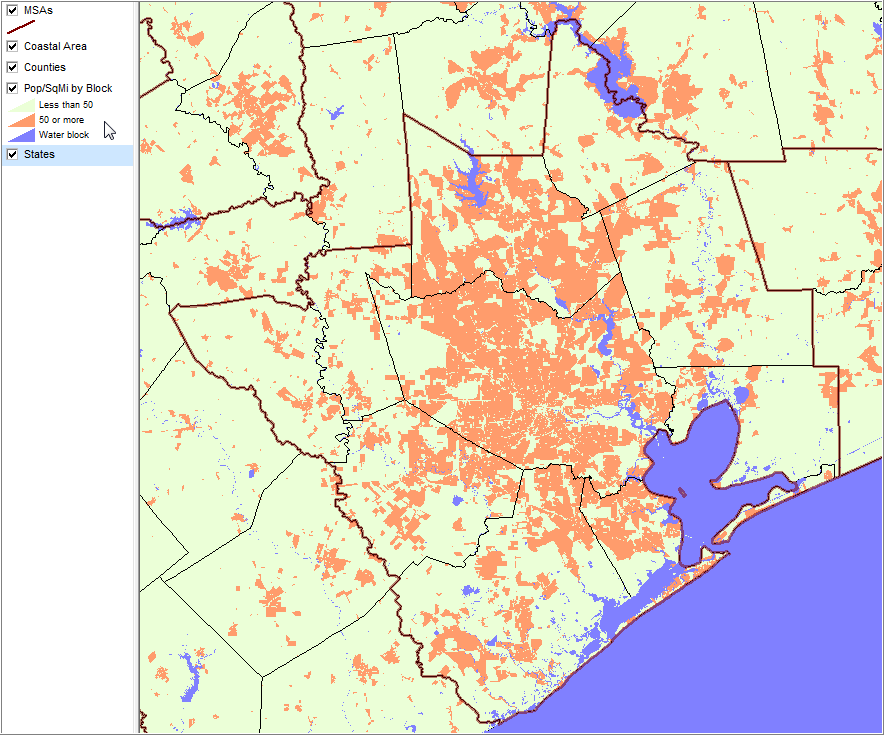
Using the CommunityViewer Layer Editor, the above view is developed by using an SQL-like query applied to the layer/shapefile. This setting is shown in the following Layer Editor view (invoked by dbl-clicking the layer name in the legend panel). This can be saved or used dynamically. P001001 is total population, arealand is land area in square meters, the constant adjusts the computed value to square miles. Any of the items in the block database may be accessed/manipulated in this manner. Area colors are set using the Area tab. Given the number of blocks in this view perspective, the block boundary width has been intentionally set to zero, so contiguous same color blocks appear to “run together.”
|
View shows 5 section interval pattern with black block boundaries for sections 1 and 2. View developed using the Proximity C2KBLK database -- http://proximityone.com/c2kblk.htm.
|
View developed using the Proximity C2KBLK database -- http://proximityone.com/c2kblk.htm. Uses different interval settings; boundary not displayed for red due to density Identify tool used to profile selected block (see pointer)
|