
|
|
|
... and related demographic analysis Knowing about a geographic area by its urban/rural status is important for many reasons ... the Federal Communications Commission (FCC) requires service providers to identify their deployment areas by census block. Internet service provider incentive programs exist that are geared toward rural areas. Telcom businesses increasingly use census block geography to determine/analyze markets. The related FCC E-Rate program uses urban/rural status to manage rate structures. Many Federal transportation programs rely on a clear distinction between urban and rural areas. Businesses might be interested in reaching markets that are predominantly rural versus suburban versus urban. Emergency service operations may differ by urban/rural status for many regions; being able to plan for low density population areas can be essential. There is a long list of reasons for importance, not the least of which are the societal implications as the U.S. continues to become more urban and less rural. Based on the Census Bureau urban/rural definition, the Census 2010 U.S. urban population was 249,253,271 (80.7%) and the rural population was 59,492,276 (19.3%). The Census Bureau urban-rural classification is a delineation of geographical areas identifying both individual urban areas and rural areas of the nation. Urban areas are densely developed territory, and encompass residential, commercial, and other non-residential urban land uses. The Census Bureau does not identify geographic areas as "suburban." There is no Census Bureau classification for suburban areas or suburban population. We will cover the topic of suburban areas and suburban population in the near future. More about the urban population. About this Section This section is focused on use of GIS resources to visually analyze patterns of urban/rural geography based on Census 2010 census blocks. We review census block level geography and urban/rural status in the context of a metro, an urbanized area, a city/place, a school district, and census tract. Applications illustrated here make use of the Austin-Round Rock, TX metro; similar views/applications may be developed for any county or metro. Members of the ProximityOne User Group ( join now, no fee) may use the GIS software and project files to create similar and more detailed views/analyses. After installing CV XE GIS Windows CV XE GIS installer, expand the GIS project (userid required) to c:\cvxe\1\; start CV XE GIS; open the GIS project c:\cvxe\1\austinblks1_tract.gis. See details about using the GIS resources in the Mapping Census Blocks GIS section. Defining Urban/Rural Geography and Census Blocks For Census 2010, an urban area is a densely settled core of census tracts and/or census blocks that meet minimum population density requirements, along with adjacent territory containing non-residential urban land uses as well as territory with low population density included to link outlying densely settled territory with the densely settled core. To qualify as an urban area, the territory identified according to criteria must encompass at least 2,500 people, at least 1,500 of which reside outside institutional group quarters. There are two types of urban areas: • Urbanized Areas (UAs) of 50,000 or more people • Urban Clusters (UCs) of at least 2,500 and less than 50,000 people As of Census 2010, there were 3,573 urban areas comprised of 486 urbanized areas (UAs) with population 219,922,123 and 3,087 urban clusters (UCs) with population 29,331,148. Rural encompasses all population, housing, and territory not included within an urban area. A census block is the smallest geographic tabulation area and is classified as either all urban or all rural. More about census blocks. Austin-Round Rock Metro by Census Block In the following view, the Austin-Round Rock 5-county metro is shown with the bold brown boundary. Blocks with the orange fill pattern shows all census blocks classified as urban in the metro; rural blocks have a gray fill pattern. This view is developed by setting the block layer query to UR10='U'. 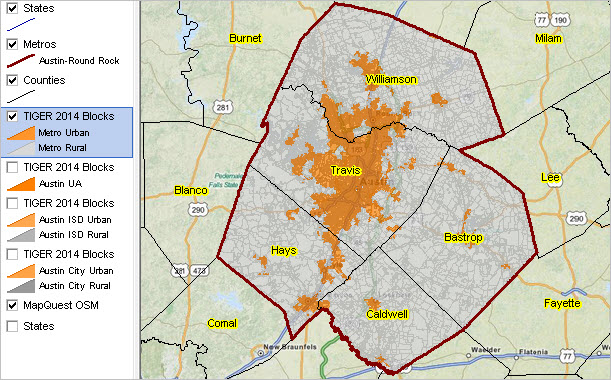 Click graphic for larger view. View created using CV XE GIS and related GIS project. Use the GIS project to create similar views. Zoom to an area of interest. Add name, codes, or data values as labels. Add other geography. A selection of possibilities is shown below. Austin-Round Rock Urbanized Area by Census Block Blocks with the orange fill pattern comprise the Austin-Round Rock Urbanized Area. This view is developed by setting the block layer query to UACE10='04384' (urban section). 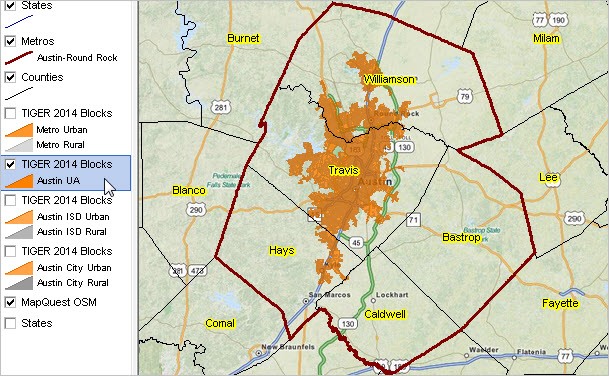 Click graphic for larger view. Austin City by Census Block Blocks with the orange fill pattern are urban blocks within Austin city. This view is developed by setting the block layer query to UR10='U' and place='05000' (urban section). 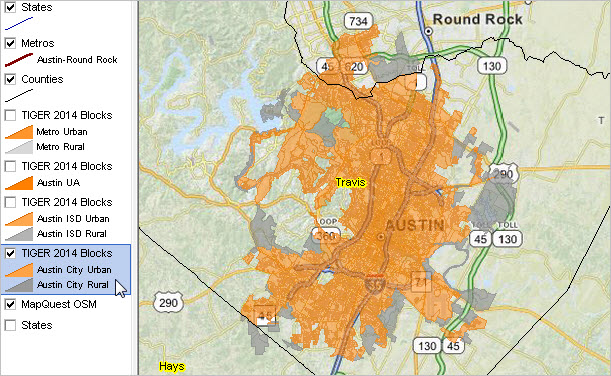 Click graphic for larger view. Austin ISD School District by Census Block Blocks with the orange fill pattern are urban blocks with the Austin ISD school district. This view is developed by setting the block layer query to SDUNI='08940' and ur10='U' (urban section). 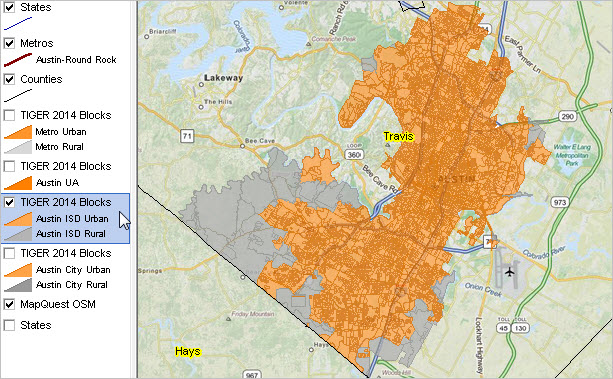 Click graphic for larger view. Travis County Census Tract "19.14" by Census Block The next view shows a zoom-in to census tract "19.14" in Travis County, TX. See more about census tracts. Blocks with the orange fill pattern are urban blocks; rural blocks have a gray fill pattern. This view is developed by setting the block layer query to SDUNI='08940' and ur10='U' (urban section). The Census 2010 total population is shown as a label for each census block. 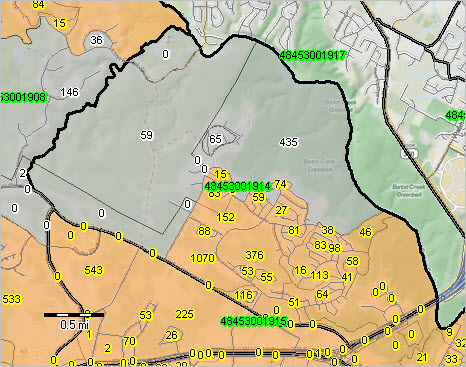 Click graphic for larger view. GIS Project See Mapping Census Blocks GIS for information on using GIS resources on your computer to develop map views similar to those shown above for your areas of interest. Modify map views by zooming to specific geography, label geography, modify color/fill patterns, add different subject matter, add other geography, perform related geospatial analyses. Support Using these Resources Learn more about accessing and using decision-making data; examine characteristics and patterns for your study areas and applications. Join us in a Decision-Making Information Web session. There is no fee for these one-hour Web sessions. Each informal session is focused on a specific topic. The open structure also provides for Q&A and discussion of application issues of interest to participants. Additional Information ProximityOne develops geographic-demographic-economic data and analytical tools and helps organizations knit together and use diverse data in a decision-making and analytical framework. We develop custom demographic/economic estimates and projections, develop geographic and geocoded address files, and assist with impact and geospatial analyses. Wide-ranging organizations use our tools (software, data, methodologies) to analyze their own data integrated with other data. Follow ProximityOne on Twitter at www.twitter.com/proximityone. Contact us (888-364-7656) with questions about data covered in this section or to discuss custom estimates, projections or analyses for your areas of interest. |
|
|