Census 2010
-- Detailed Demographics to the Census Block Level; 11+ Million Blocks
Starting with Census 2010, the decennial census and annual American Community Survey (ACS) are integrally connected.
This section is focused on topics concerning Census 2010/ACS data access and use, applications using these data and the
integration and analysis of these data with other data. Importance of the decennial data - see below
10.19.17. 115th Congressional Districts Summary File 1 Update
- release date 10/19/17
- 115th Congressional Districts section - http://proximityone.com/cd115.htm
- Technical documentation for corresponding 113th CD Census 2010 SF1 data
... no specific CD115 retabulation documentation
... file structure is the same; data retabulated for Florida, Minnesota, North Carolina and Virginia.
- Data Access -- FTP Downloads
03.27.17. County Urban Rural Characteristics
- Census 2010 compared to 2016
- interactive table & GIS applications
- see: http://proximityone.com/county_urban_rural.htm
Counties by Percent Urban Population; Census 2010:
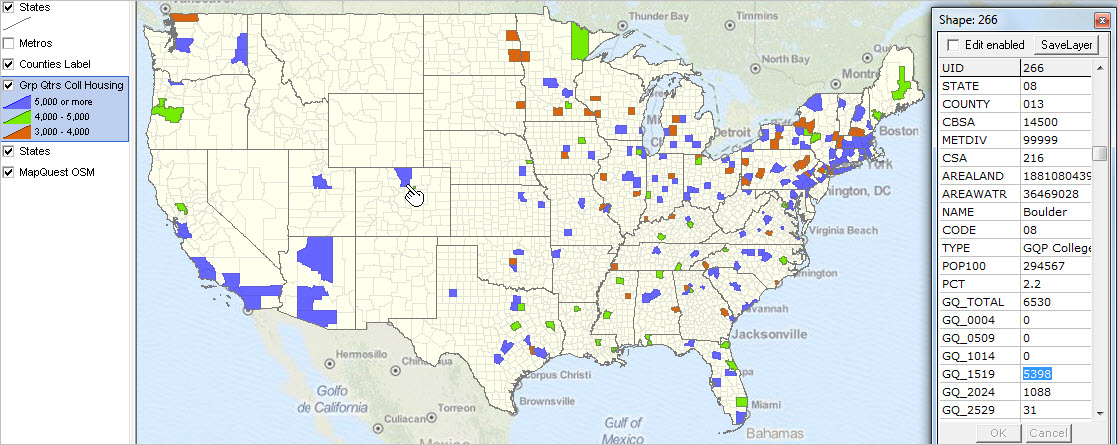
02.22.16. Analyzing County Group Quarters Population
- interactive table & GIS applications based partly on Census 2010 SF1
- see: http://proximityone.com/group_quarters..htm
11.13.14. Census 2010 PUMS Files Released
- Census 2010 Public Use Microdata Sample Files
- Released 11.12.14
- more information: http://proximityone.com/cen2010_pums.htm
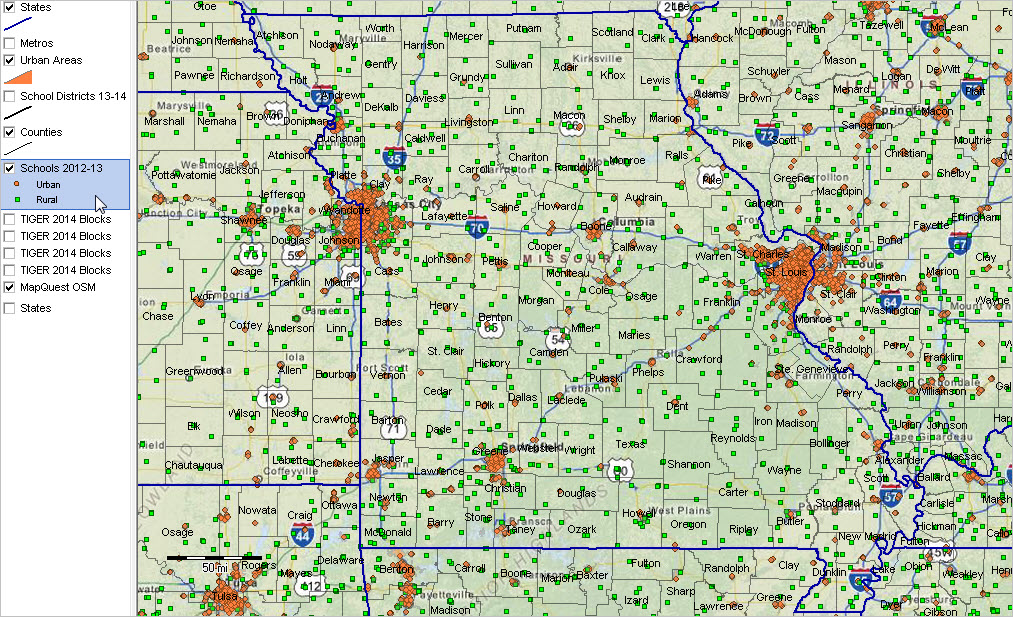
10.08.14. K-12 School Urban/Rural Status based on Census Block
- assigning Census 2010 census block code & urban area code to each K-12 school
- all schools interactive table: http://proximityone.com/sch1213ua.htm
11.16.13. Using Census 2010 Summary File 1 Census Block Data
- Skip the downloads! Extract data for specified blocks and subject matter (at item level).
- Create dbase file for tabular processing and/or integration into shapefile for geospatial analysis.
- Use CV XE APIGateway to extract census block data from Census 2010 SF1.
- The no fee version of CV XE APIGateway supports this operation.
- See overview.
04.11.13. Census 2010 Summary File 1 Released for 113th Congressional Districts
- population by age, gender, race/origin; household type & relationship; group quarters
- housing units by own/rent/tenure; vacancy; related attributes
- retabulated for the congressional district boundaries of the 113th Congress
- 113th Congressional Districts: http://proximityone.com/cd113.htm
- check back for details on access
02.28.13. Integrating 1990, 2000 & 2010 Census Demographics
- use the S&O Server
access/integrate 1990, 2000 & 2010 Census demographics
- data accessible for multiple geographic levels down to
block group
- integrate these decennial data with data from
ACS and other sources
- data access via APIs; avoiding handling of cumbersome datasets
- 1990 & 2000 Census datasets added as of 2/28/13
- see scope of data resources: http://proximityone.com/s&o/guide/server_datasets.htm
02.18.13. Analyzing Native American Area Demographic-Economic Characteristics
- use the S&O Server to examine detailed characteristics of Native American areas
- example for Navajo Nation (using ACS 2011 data)
- all American Indian, Alaska Native and Hawaiian Home Land Areas
- view/query/compare areas using interactive table --http://proximityone.com/aianhhl.htm
- table based on Census 2010 American Indian and Alaska Native (AIAN) Summary File
-- released Dec 2012 -- includes all Native American areas
02.13.13. Integrated Access/Analysis of ACS 2010, ACS 2011, Census 2010 Data
- new S&O Server custom spreadsheet feature
- build custom spreadsheet for any mix of ACS2010 ACS2011 Census2010 items
- any mix of geography including census block and block group
- see extended profile block group example with ACS2010 ACS2011 Census2010 mix
- see more about S&O Custom Spreadsheet
01.28.13. 113th Congressional District Urban/Rural Characteristics
... urban and rural population and housing data summarized by 113th Congressional District.
... based on Census 2010 Summary File 1 urban/rural update (released September 2012).
... interactive ranking table ... http://proximityone.com/cd113_2010_ur.htm.
01.14.13. Summary File 1 Urban/Rural & Congressional District 113 Update
... Summary File 1 updated with urban/rural codes and summary data
... superceded by 1/14/13 update (see above)
08.07.12. Use Census APIs to access Census 2010 via S&O Server
... use no fee S&O Server to access detailed Census 2010 Summary File 1 data
and data for a wider range of geography down to block/block group level
... most tables/items from Census 2010 Summary File 1
... start using S&O Server today: http://proximityone.com/s&o/guide/server.htm
07.13.12. Population and Housing Unit Counts Reports Available
Summary Population and Housing Characteristics Reports (CPH-1)
... tables on age, sex, race, Hispanic or Latino origin, households, families,
housing tenure and occupancy, population density, and area measurements.
Lowest level of geography is city/place.
Report for each state, DC, PR and US.
Reports being released on a state-by-state basis.
http://www.census.gov/prod/cen2010/index.html.
Population and Housing Unit Counts Reports (CPH-2)
... tables providing population and housing unit counts from
2010 Census and selected historical censuses.
Lowest level of geography is city/place.
Report for each state, DC, PR and US.
Reports being released on a state-by-state basis.
http://www.census.gov/prod/cen2010/index.html.
04.12.12. Analyzing Census Tract GeoDemographic Change 2000-2010-2012
... view/analyze Census 2000 tracts and corresponding Census 2010 tracts
see http://proximityone.com/tracts_2000_2010.htm
... examine FFIEC HMDA/CRA Census 2000 service area tracts
with corresponding new Census 2010 service area tracts
... view Census 2000 & Census 2010 tracts side-by-side with associated demographics
... associate ACS 2010 5-year estimates with Census 2000 & Census 2010 tracts
... examine implications of changing tract boundaries and demographics
03.26.12. New Urban/Rural Geography and Demographics
... Census releases new Census 2010-based urban area geography and demographics
see http://proximityone.com/urbanpopulation.htm
... view list of all Census 2010 urban areas with population, area and population density
... compare with Census 2000 urban areas and demographics
... examine integration of these data using GIS for visual analysis.
03.19.12. Using the Census Bureau TIGER Web Map Server
... Visually examine distribution/relationship of Census 2010 geography:
see http://proximityone.com/cvxe_wms.htm
... drill-down to the census block (11+ million areas) level for anywhere in the U.S.
... view school district boundaries in context of other geography
... integrate views based on your shapefiles with TIGER WMS ... all free.
01.22.12. 2010 Equal Employment Opportunity (EEO) Special Tabulation
... counterpart/update to the Census 2000 EEO special tabulation; based on ACS 2010
... could not be developed from 2010 decennial census due to limited scope questionnaire
... enabling EEOC compliance analyses and wide range of other workforce analyses
... http://proximityone.com/acs0610_eeo.htm
01.05.12. 1940 Census Records to be Released
... 1940 census records will be released 4/2/12 (digital imagery via NARA facilities).
... the 72-year restriction on access to maintain privacy will then have passed.
... watch here for updates.
12.15.11. ACS 2010 Demographics for Census 2010 Census Tracts
12.07.11. Access/View Census 2010 Demographics integrated with Google Maps
... applications that enable viewing demographics in context of your shapefiles/geography
... application illustrates use of census tracts, school district & schools
... http://proximityone.com/sd/36/m3614850b.htm
11.29.11. Compare Census 2010 with American Community Survey 2010 Estimates
... interactive ranking table ... view/rank/query school districts
... states, metros, counties, school districts
... areas with 65,000+ population
... http://proximityone.com/acs2010.htm
Census 2010 Demographics for Census 2000 Geography
Census 2010 demographics are now available for Census 2000 geography.
These data are available for census blocks, census tracts and higher level geography.
The data are organized as national and state level datasets.
Examine, for example, how the population has changed between 2000 and 2010 has changed for individual census tracts or groups of tracts
(county, metros, study areas, etc.).
Many Census 2010 census tract boundaries differ from Census 2000 boundaries.
Contact us (mention Census 2010 demographics for Census 2000 geography)
or call (888) 364-7656 for additional information.
Projections to 2020 Using Census 2010 Demographics
Use the new demographic estimates and projections interactive ranking table at
http://proximityone.com/demographics2020.htm
to view/rank/compare population change 2000 to 2020
for the U.S. overall, states, metros and counties. Analyze area patterns and trends and assess how areas of interest relate to each another.
These new estimates and projections reflect Census 2010 results.
They are a part of a broader set of annually updated current demographic-economic estimates and
projections developed by ProximityOne using the Situation & Outlook modeling tools.
The estimates and projections are developed using simultaneous equation models that
knit together a mix of historical birth, death, migration, economic and other data and assumptions.
Use the ranking table at http://proximityone.com/zip-place.htm
to view a city/place by ZIP code and selected associated demographics for each ZIP code portion
in that city/place. Examine how split ZIP codes are split by specific place and non-place areas.
The data are also available as a national scope dataset.
Census 2010 ZIP Code Tabulation Areas (ZCTAs)
and Places geographies are both comprised of sets of census blocks.
Census block level data from the
Census 2010 Summary File 1 (SF1)
have been aggregated into ZIP code-Place parts to develop these data.
Single year of age data are are essential in many demographic analyses and the development of projections.
The Census 2000, and now Census 2010, Summary File 1 (SF1) Table "PCT12"
single year of age population data are widely used
by many types of organizations for many types of applications.
The PCT12 data uniquely provide access to "lowest common denominator"
single year of age detail from under 1 year to 100 years of age for
wide-ranging geographic areas enabling users
to construct age cohort data not otherwise available.
Table PCT12 is replicated for several race/ethnic combinations adding to analytical possibilities.
While the Census Bureau FactFinder (FF2) can be used to "call-up" and display/download the PCT12 data,
it is difficult to use the data directly, or even open downloaded data with a tool such as Excel, and easily view the data.
Effective usage challenges include:
• Age detail iterated by gender is cumbersome to aggregate.
• Comparison of aggregated gender data for one area to another is tedious.
• Labeling age detail in Excel-type applications is time consuming and challenging.
• Computing percentages requires additional steps.
• Aggregating the data across areas of interest (e.g., 5 census tracts) requires time.
Use the no cost Modeler II (M2) software to analyze the PCT12 data and resolve issues such as listed above.
These are also basic features required for the "next step" primary purpose of M2 --
developing population projections by age-gender-race/ethnicity for
census tracts and higher level aggregates of census tracts (including counties, metros, states)
as well as
cities/places,
towns, school districts, congressional districts, ZIP code tabulation areas among other geography.
06.08.11 Census 2010 Summary File 1 - first more detailed data at census block level
The Census 2010 Summary File 1, being released on a state-by-state flow basis during June-August 2011,
provides access to the first more detailed data at census block and higher geographic levels.
- P.L. 94-171 Redistricting Data Files provide access to block level data but only for a relative small number of items.
- Demographic Profile Summary Files provide access to a few more subject matter items but summarized only for a few geographic levels
(down to city/place).
State Release Status
• June 16, 2011: Alabama, Hawaii
Follow this section to learn more about easier access to the Census 2010 SF1 data; linkage with Census 2000 SF1 data,
American Community Survey data, non-Census data; and more effective ways to analyze these data in the context of now and the future.
06.05.11 Census Count Question Resolution Program Underway
The Census Bureau Census 2010 Count Question Resolution (CQR) program was created to
address instances where a state, local or tribal government believes a boundary,
geocoding or processing error was made in the 2010 Census for their jurisdiction.
Among other reasons, challenges may be more popular with the 2010 Census compared to previous censuses due to 1) the state of the economy and
perceived need for Federal funds allocated based on the Census data and 2) the hype the Census Bureau itself created
by associating the importance of completing the questionnaire with getting the jurisdictional entity
its proper share of Federal funds (allocated on the basis of Census data).
Census will not make any changes to the apportionment data, redistricting counts or official 2010 Census data based on CQR results.
Census will post a list of the jurisdictions that file challenges to their 2010 Census counts starting on June 6, 2011, and keep the list updated.
See more about the Census 2010 CQR Program.
06.03.11 Analyzing Asian Census 2000-2010 Population by Metro
As the U.S. total population increased from Census 2000 281.4 million to Census 2010 308.7 million (9.7 percent), the Asian population increased from 10.2 million to 14.7 million (43.3 percent).
Use interactive ranking table to view/rank/compare patterns of the Asian population by Asian by sub-group by metropolitan area.
http://proximityone.com/cen2010_asian.htm.
06.02.11 State Population by Age: Census 2000, 2010, 2000-10 Change
The U.S. 2010 Census 308.7 million population reflects a 9.7 percent increase 2000 Census 281.4 million population.
Growth over the decade was slower than experienced from 1990 to 2000 (13.2 percent) but similar to the 1980 to 1990 (9.8 percent).
• Table 1: U.S. Population 2000, 2010 & Change 2000-10 by Age & Gender
• Table 2: U.S. Population 2000, 2010 & Change 2000-10 by 5 Year Age Cohorts
• Interactive ranking table: rank/view/compare
state by state population 2000, 2010 & change 2000-10 by age & gender
05.16.11 Census 2010 ZIP Code Shapefiles and Demographics
The U.S. national scope and state Census 2010 ZIP Code Tabulation Area (ZCTA) shapefiles are now available.
We have summarized the P.L. 94-171 redistricting census block level data to ZCTA boundaries/areas.
As a result, we now have Census 2010 subject matter dataset by 5-digit ZCTA as well as a shapefile with integrated demographics
for thematic mapping.
Contact us (mention ZCTA)
or call (888) 364-7656 for additional information.
ZCTAs are approximate area representations of U.S. Postal Service (USPS) five-digit ZIP Code service areas created using whole census blocks.
There are 33,120 Census 2010 ZCTAs covering the U.S. Most states have ZCTAs covering the state wall-to-wall. But there are no ZCTA polygons defined
for many more sparsely populated areas.
ZCTAs are defined by allocating each census block that contains addresses to a single ZCTA that reflects the most frequently occurring ZIP Code for the addresses within that tabulation block. Blocks that do not contain addresses but are completely surrounded by a single ZCTA are assigned to the surrounding ZCTA; those surrounded by multiple ZCTAs are added to a single ZCTA based on limited buffering performed between multiple ZCTAs.
The ZCTA five-digit code represents the most frequently occurring USPS ZIP Code within that ZCTA. There are significant changes to the 2010 ZCTAs delineation from that used in Census 2000. For 2010 only legitimate five-digit areas are defined so there is no longer full national scope coverage. The 2010 ZCTAs better represent the actual Zip Code service areas because the Census Bureau initiated a process before creation of 2010 blocks to add block boundaries that split polygons with large numbers of addresses using different ZIP Codes.
05.09.11 Census 2010 Demographic Profile Summary Files
The Demographic Profile Summary File (DPSF) is the second major Census 2010 dataset,
released in May 2011 following release of the P.L. 94-171 redistricting data.
The DPSF contains approximately 200 subject matter items ...
100 percent data asked of all people and about every
housing unit on topics such as sex, age, race, Hispanic origin, household relationship, household
type, group quarters population, housing occupancy, and housing tenure.
The DPSF is released as individual files for the U.S., each state, D.C. and Puerto Rico.
Released on a flow basis, data for all states are expected to be available by the end of May.
These are the first "more detailed" age-related and household characteristics data to be released from
Census 2010. The low-level tabulation geography is city/place and minor civil divisions ... there are no census
tract or school district summary data included.
See more information describing the geographic tabulation summary levels
and full detail on subject matter table shells at
http://proximityone.com/cen2010_dpsf.htm.
Access the DPSF data using the Demographic Data Analyst (DDA) software.
See more about the DDA software, with examples of using the DPSF data,
at http://proximityone.com/dda.
Integrate the Census 2010 DPSF data with ACS 2009 "richer demographics" data.
04.20.11 Census 2010 Advance Group Quarters Data
Census released the 2010 Census Advance Group Quarters Summary Data on 4/20/11.
These data provide an early version of table P42 from the 2010 Census Summary File
1, showing population counts for seven types of group quarters. The
institutionalized group quarters categories include correctional facilities
for adults, juvenile facilities, nursing facilities/skilled-nursing
facilities and other institutional facilities; while the
noninstitutionalized group quarters categories include college/university
student housing, military quarters and other noninstitutional facilities.
Data are provided for states, counties, census tracts and blocks.
This table will only be available via the FTP site
and is identical to table P42 in Summary File 1 to be released this summer.
At that time, characteristics of the group quarters population will also be
available.
P42. GROUP QUARTERS POPULATION BY GROUP QUARTERS TYPE [10]
Universe: Population in group quarters
Proximity provides access to these data is an 'easy to use/integrate' data file structure.
Contact us (mention Census 2010 group quarters data)
or call (888) 364-7656 for additional information.
04.06.11 Almost 10,000 Census 2010 Census Blocks Have over 1,000 Population
Of the Nation's more than 11 million Census 2010 census blocks, 9,777 blocks have a population of more than 1,000 people.
Collectively, these blocks have more than 14 million residents.
04.05.11 Census 1990-2000-2010 U.S. by City|Place Population & Housing Ranking Table
Use the interactive ranking table at
http://proximityone.com/places0010.htm
to rank, compare and contrast U.S. city/place population and housing data from the 1990 Census, Census 2000, Census 2010 and change 2000 to 2010.
Data include land and water area for each census.
03.31.11 Census 2000-2010 U.S. by School District Population Interactive Ranking Table
Use the interactive ranking table at
http://proximityone.com/sd0010.htm
to rank, compare and contrast U.S. by school district population ... Census 2000, Census 2010 and change 2000 to 2010.
03.30.11 Census 2000-2010 U.S. by County Demographics Interactive Ranking Table
Use the interactive ranking table at
http://proximityone.com/counties0010.htm
to rank, compare and contrast U.S. by county population and housing units ... Census 2000, Census 2010 and change 2000 to 2010.
03.29.11 Census 2000-2010 U.S. by Metro Demographics Interactive Ranking Table
Use the interactive ranking table at
http://proximityone.com/metros0010.htm
to rank, compare and contrast U.S. by metro population and housing ... Census 2000, Census 2010 and change 2000 to 2010.
03.28.11 Census 2000-2010 U.S. by State Demographics Interactive Ranking Table
Use the interactive ranking table at
http://proximityone.com/st0010.htm
to rank, compare and contrast state by state
population and housing as of Census 2000, Census 2010 and change 2000 to 2010.
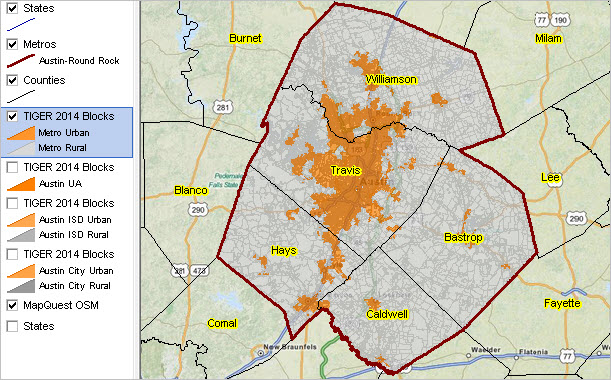
02.18.11 Thematic Mapping & Geospatial Analysis
The Census 2010 TIGER/Line shapefiles
contain no demographic data as developed/released by Census.
Proximity integrates demographic data into the shapefiles enabling them to be added to GIS projects
for wide-ranging thematic mapping and geospatial analyses.
For details and examples focused on census block level analysis, see
http://proximityone.com/cen2010_blocks.htm.
02.03.11 P.L. 94-171 Redistricting Data Ranking Tables and Analytical Resources
The 2010 P.L. 94-171 redistricting data provide the first sub-state Census 2010 data.
Use the interactive ranking table at http://proximityone.com/cen2010_pl94171.htm
to view selected summary level data for all states.
01.20.11 Census 2000 - Census 2010 Census Block Equivalencing
National scope Census 2000-Census 2010 census block equivalance data are now available.
Census block boundaries changed for many areas between Census 2000 and Census 2010.
Census blocks are the smallest geographic areas for which decennial census data are tabulated.
Census blocks are the elemental geographic area for all decennial census political and statistical tabulation areas.
Each county, city, school district, census tract, etc. is comprised of a set of census blocks.
There were 8.2 million census blocks for Census 2000 compared to 11.1 million census blocks for Census 2010 (an increase of 2.87 million or 35 percent).
When comparing demographic patterns and change between Census 2000 and Census 2010 it is typically important to be able to compare the same geography.
For example, what is/was Census 2000 block 1007 in tract 4124.00 (aka 4124 aka 412400) in Harris County (201) Texas (48)
is subdivided into several blocks for Census 2010.
See these relationships by map view and tabularly in the
Census 2000 - Census 2010 Census Block Relationships Gallery views.
Prospective new alignments in geographies such changing, alternative boundaries for congressional districts, state legislative districts, trade areas, enterprise zones,
city/township board areas, school district attendance zones, among others need to take into account how component census blocks compare between Census 2000 and Census 2010.
Census 2000-Census 2010 census block equivalance data provide this ability.
The Census 2000-Census 2010 census block equivalance data are now available in the form of dataset or integrated into national scope
census block shapefiles. See additional information at http://proximityone.com/cen2010_blocks.htm
12.14.10 How Many Census Tracts, Block Groups & Related Tabulation Geographies?
We are updating the tabulation geographies by state table at
http://proximityone.com/tigerline.htm#updates
as the TIGER/Line files are released. New TIGER/Line files are being released weekly.
View the table in expanding text section "Census 2010 TIGER/Line Files by State with 2000/2010 Area Counts".
The table is updated daily/weekly and will be expanded in scope.
12.03.10 Census Blocks Increase to 11.2 Million in Census 2010
The number of census blocks defined for the Census 2010
(50 states, D.C., and Puerto Rico) is 11,155,486.
For Census 2000, 8,262,363 census blocks were defined for the same area.
This represents an increase of 2,893,123 census blocks, or 35 percent,
between Census 2000 and the 2010 Census.
• boundary shapefiles for all Census 2010 political and statistical tabulation areas.
• overall improvements and updates resulting from the Census 2010 LUCA program.
• extensive qualititative and coverage improvement for roads/streets.
Census 2010 demographic data for use with these shapefiles will not start to flow until February 2011,
but these shapefiles have immediate value and use independent of the demographics. Start building
updated neighborhood and trade area maps soon!
The Census Bureau has reported the Census 2010 final participation rate data by state, county, place, tract and other geography.
74 percent of households in the United States filled out and mailed back their 2010 Census questionnaire.
The results include an additional two percentage points of households that mailed back their forms
after the April 27 cut-off that marked the transition to the door-to-door follow up operation.
Although received too late to prevent a visit by a census taker, those late-arriving forms were still used for tabulating purposes.
Both the final national rate of
74 percent and the 72 percent achieved in April, matched the rates achieved during the 2000 Census.
10.11.10 America's Urban Agglomerations & Census 2010
Urban agglomerations are contiguous areas of continuously developed urban territories.
The New York urban agglomeration is home to more than 30 million people.
New information surfaces as the Census Bureau revises definitions relating to the urban geography for Census 2010.
52 prospective U.S. urban agglomerations have been identified.
The "P.L. 94-171 Redistricting Data" will be the first data released from Census 2010.
These data will provide demographic data down to the census block geographic level.
Summary. The Census Bureau proposes criteria for defining urban areas based on
the results of the 2010 Decennial Census (the term 'urban area' as
used throughout this notice refers generically to urbanized areas of
50,000 or more population and urban clusters of at least 2,500 and less
than 50,000 population). It also provides a description of the changes
from the final criteria used for Census 2000. The Census Bureau is
requesting public comment on these proposed criteria.
The Census Bureau's urban-rural classification is fundamentally a
delineation of geographical areas, identifying both individual urban
areas and the rural areas of the nation. The Census Bureau's urban
areas represent densely developed territory, and encompass residential,
commercial, and other non-residential urban land uses. The Census
Bureau delineates urban areas after each decennial census by applying
specified criteria to decennial census and other data. Since the 1950
Census, the Census Bureau has reviewed and revised these criteria, as
necessary, for each decennial census. The revisions over the years
reflect the Census Bureau's desire to improve the classification of
urban and rural territory to take advantage of newly available data, as
well as advancements in geographic information processing technology.
DATES: Any comments, suggestions, or recommendations concerning the
criteria proposed herein should be submitted in writing no later than
November 22, 2010.
ADDRESSES: Please submit written comments on the proposed criteria to
Timothy Trainor, Chief, Geography Division, U.S. Census Bureau,
Washington, DC 20233-7400.
FOR FURTHER INFORMATION CONTACT: Vincent Osier, Chief, Geographic
Standards and Criteria Branch, Geography Division, U.S. Census Bureau,
via e-mail at vincent.osier@census.gov or telephone at 301-763-9039.
08.18.10 Census 2010/ACS School District Demographics update
The first demographic updates since Census 2000 for all U.S. school districts will become available in December 2010.
Also starting in December will be the release of the Census 2010 P.L. 94-171 redistricting data on a state-by-state flow basis.
This will be the first time that school district tabulations have been a regular tabulation area for the decennial census.
These data will provide Census 2010 redistricting data by school district and reflect 2009-10 school year boundaries.
Also starting in December will be the release of the Census 2010 TIGER shapefiles on a state-by-state flow basis.
These shapefiles enable GIS and mapping applications using 2009-10 school year boundaries with wide-ranging associated
geographic features such as water features, roads, and political/statistical boundaries.
See additional details ... what to expect/plan for ...
Population Trends 2000-2010 by State -- Interactive Ranking Table
Click column header to sort; click again to sort other direction.
See related Ranking Tables Main Page;
... earlier posts ...
Accessing Census 2000 Data
Most who interested in Census 2010 are also interested in using Census 2000 data.
As the sets of data from decennial and American Community Survey programs grow,
so do complexties in navigating through data access operations.
Use the ACS 2006-08 all tabulation areas interactive ranking table to view geographic areas of interest.
Apply filters to examine a selected state and/or type of geographic area (e.g., congressional districts, metros,
school districts, cities, etc.).
Rank and compare areas of interest based on selected subject matter items.
Final Metropolitan Statistical Area Updates for Census 2010
See the
changes, updates and latest definitions
for U.S. metropolitan statistical areas as designated by the U.S. Office of Management and Budget
based on the latest Census Bureau county-level population estimates.
Metropolitan statistical area designations are typically updated annually.
Census 2010 data tabulated for Core-Based Statistical Areas (Metropolitan Statistical Areas and Micropolitan Statistical Areas)
will be for geography as described in that document.
LUCA/MAF TIGER Updates -- Building an Accurate Address List
On October 21, 2009, the Subcommittee (of the House Committee on Oversight and Government Reform)
on Information Policy, Census and National Archives held a hearing to examine the 2010 Census Master Address File (MAF).
See this link to access testimony presented by
Census,
GAO, and others.
... from the GAO report regarding the address canvassing program ...
The Bureau's address list at the start of address canvassing consisted of 141.8 million housing units.
Listers added around 17 million addresses and marked about 21 million for deletion.
All told, listers identified about 4.5 million duplicate addresses,
1.2 million nonresidential addresses, and about 690,000 addresses that were uninhabitable structures.
... from the GAO report regarding results of
Local Update of Census Addresses (LUCA) ...
Of approximately 36 million addresses submitted, about 27.7 million were already in the MAF.
Around 8.3 million updates were not in the MAF and needed to be field-verified during address canvassing.
Of these, about 5.5 million were not added to the MAF because they did not exist,
were a duplicate address, or were nonresidential.
FY 2010 Federal Statistical Budget; AgencyProgram RankingTable
The FY 2010 budget request (by OMB) of $7.4 billion will provide continuing support for the Census Bureau cyclical programs,
including $6.9 billion for the 2010 Decennial Census program, $116.9 million for the Economic Census funding cycle,
and $8.9 million for the Census of Governments funding cycle.
The request for the Decennial Census program includes $200.0 million for the American Community Survey,
$18.3 million for the Master Address File/Topologically Integrated Geographic Encoding and Referencing
(MAF/TIGER)
Enhancements Program, and $6.7 billion to conduct major operations for the 2010 Decennial Census.
In addition to the new budget authority requested for the 2010 Census program,
$897.9 million in additional funding will be available from carry over of FY 2009 funding from the
American Recovery and Reinvestment Act of 2009.
DMIGateway Supports ACS 2008 & 2006-08 Data Access
DMIGateway supports access
to the ACS 1-year and ACS 3-year data including the 2008 1-year and 2006-2008 3-year data.
DMIGateway will support no fee access to Census 2010 and future ACS data using a simple standardized menu.
DMIGateway enables Web-based access to selected Federal and other geographic and demographic-economic data resources.
The many diverse Federal statistical agencies have their own Web protocols for data access and structure data differently.
DMIGateway simplifies data access by removing many steps and using a single protocol for accessing these diverse,
multi-sourced data. DMIGateway Level 1 is available on at no fee with no required registration.
Get started here.
How has "language spoken at home" changed between 2000 and 2008 for the Houston Independent School District, TX?
Start up DMIGateway select school districts, Houston ISD, Census 2000 SDST, Table 19 ... Get Data ... profile appears.
Next, change only Select Dataset to ACS 1-year ... Get Data ... view social characteristics section to view similar data.
2009 TIGER/Line Shapefiles Released 10/09
The 2009 vintage TIGER/Line shapefiles were released by the
Census Bureau on October 1, 2009 (about shapefiles).
The next update to the TIGER/Line Shapefiles will be the Census 2010 version to be released in mid-2011.
An important feature of the 2009 vintage TLS is that they include
boundaries of governmental units (such as cities/places) in effect as of January 1, 2009,
and legal and statistical area boundaries that have been adjusted and/or corrected since Census 2000.
In a GIS application, this enables geospatial analysis of non-Census data such as tax parcels, 911 address data, etc., with the
current legal boundary of incorporated cities.
See this example
of the 2008 vintage TLS incorporated place compared to the 2009 vintage TLS boundary for the same place.
The Proximity CommunityViewer GIS software, Level 1 and above,
enables the user to download these shapefiles from a Webserver and integrate the shapefiles into existing GIS projects.
See TIGER/Line Shapefiles for more information about using these
shapefiles and how they are augmented by Proximity in ways that can benefit you.
Using the 2008 ACS 1-Year Data -- Congressional Districts
ACS 2008 data reviewed here were released by Census in September 2009. Corresponding 2009 data will be released in September 2010.
New York Congressional District 16 had the lowest 2008 median household income ($22,912)
among all 111th Congressional Districts while Virginia Congressional District 11 had the highest 2008 median household income ($107,393).
See map view of New York CD 16.
Which districts have highest/lowest percent high school graduates?
Where do your Congressional Districts of interest rank based on these and other demographic measures?
Use the interactive ranking table at http://proximityone.com/cd.htm
to examine selected 2008 demographics for the 111th Congressional Districts based on data derived from the
2008 American Community Survey and population change between 2007 and 2008.
See the ranking table with corresponding data for 2007 demographics at
http://proximityone.com/cd111_07rt.htm.
111th Congressional District Demographic Profiles.
See links at http://proximityone.com/cd.htm to access Congressional District demographic profiles in dBase structure suitable for integration into shapefiles
and/or direct use with Excel and other software that can process dBase files.
ACS 2005-07 School District Special Tabulation
The ACS 2005-07 3-year estimates were released in the fall 2008. Since that time, the Census Bureau has developed a
variation of the School District Special Tabulation for school districts and all geographic areas with populations of 20,000 or more.
The special tabulation was developed under sponsorship of the U.S. Department of Education.
With some exceptions, the subject matter corresponds to that of the previously released ACS 2005-07 3-year estimates.
These data provide the first wide-ranging demographic update since Census 2000 for these universes for school districts with population 20,000 and over.
Further update. The ACS 2006-08 School District Special Tabulation (SDST) data became available in mid 2010.
Updated data for applications described here are now available.
See the ACS section for more details.
An important feature of the ACS SDST data is that they are tabulated for the total population as well as the following universes:
• Children enrolled and not enrolled
• Children enrolled
• Children not enrolled
• Children enrolled in public school
• Children enrolled in private school
Grade relevant children are defined as the population ages 0 to 19 who are residents of that area and not high school graduates.
Example. Houston ISD, TX -- Children Not Enrolled in School
ACS 2005-07 School District Special Tabulation
-- one of hundreds of subject matter tables available
-- available for any school district with population 20,000 or more
Total:
30,035
Male:
17,035
Under 5 years
9,140
5 to 9 years
1,725
10 to 14 years
590
15 to 17 years
2,285
18 and 19 years
3,295
Female:
13,000
Under 5 years
7,440
5 to 9 years
1,355
10 to 14 years
550
15 to 17 years
1,200
18 and 19 years
2,455
In summary, there 13,455 estimated school age children not enrolled in school (age 5-19 and not high school graduate)
in the Houston ISD, TX school district (2005-07 'annualized' estimate). This population is a 'quasi-superset' of the
population who are high school dropouts (as measured at one time centered on the period 2005-07).
Use the Proximity School District Dynamics integrated software and database resource to access and analyze these data.
The Federal Register document http://edocket.access.gpo.gov/2009/E9-4803.htm
provides extensive details on American Community Survey planning.
Beginning in late 2010, the Census Bureau plans to
introduce 5-year data products covering the period of 2005-2009. The
Census Bureau is proposing to modify its current line of data products
to accommodate the 5-year estimates and is requesting comments from
current and potential users of ACS data products to help guide this
modification. The release of the 5-year estimates will achieve a goal
of the ACS to provide small area data similar to the data published
after Census 2000, based on the long-form sample.
Both notices are on the Census Bureau Website: Participant Statistical Areas Program.
The block group notice announces the Census Bureau's decision that the minimum population threshold for block groups will continue to be 600 persons.
Census 2010 & GeoDemographics ... the importance to you ... goto top
notes & observations by Warren Glimpse
Perspectives ... saying 'why Census 2010 & GeoDemographics are important to you' is elusive.
Followers, stakeholders, data users wear different hats, and more.
What is too technical for some is too simplistic or irrelevant to others.
During the lead-up to Census 2010, perhaps the strongest appeal heard for the involvement of every American,
was to get the local area's correct share of Federal funds.
While this might seem like a good selling point to increase response rates,
it sells the true importance of Census 2010 far too short.
And while Census 2010 in undeniably important as the basis for Congressional apportionment and redistricting
at many geographic levels, this too offers a short-sighted view of the importance.
Here are some thoughts on the importance of Census 2010 to you.
First, from a more macro view, why Census 2010 is important to you ...
Census 2010 is a cornerstone for the broader set of geodemographics that enable data-driven analysis and decision-making.
We need geodemographics so that we are better able to determine 'where we are',
how things have changed and how things might change in the future. We also need to know what has changed, how much, where, and when.
Without a basic understanding of 'where we are', there is little chance that we can develop a feasible plan about 'where we want to be.'
Geodemographics help paint this picture in ways that can help with individual situations; we can pick the geography, subject matter and time
dimensions that meet our needs.
The population of the U.S. is changing minute to minute.
Every hour there are about 490 births in the country and about 280 deaths.
Roughly 12.5% of the households move each year, 1,600 per hour,
and some people leave the country and others enter the country each hour.
The U.S. population never stops changing and the nature of change varies widely by different areas and geographic granularity.
How does this impact your organization? Your constituency, members or clients?
Second, how do these geodemographics help me ...
'Geodemographics' reflects the near equal footing of geographic data and demographic data.
It can be argued that the most valuable part of Census 2010 are the TIGER shapefiles and related geographic products.
These geographic resources have vast utility independent of the demographic data; though their union makes for an even more powerful resource.
Relatedly, geographic information systems and visually based tools and technologies offer new and increasingly wide-ranging abilities to convert raw data
into more consumable and collaborative information.
Third, the importance of integrating and using multi-sourced data ...
This section is focused on methods and resources to integrate and use data from Census 2010, American Community Survey (ACS) and directly related developments.
A significant challenge in determining the 'where we are' and related matters are 1) integrating these data among themselves and 2) integrating these
data with other, typically, non-Census data. Beyond viewing data from these programs,
the very next step for most users is to attempt to associate these data with other data.
Here, we are less concerned about the telling a story as a journalist might and more concerned about tools, data and methodologies that empower journalists
to tell many diverse stories.
For a researcher, we are less concerned with developing analytical results for any one situation or discipline and more focused on the
tools, data and methodologies that empower the best possible analyses.
For K-12 education leadership, we are less concerned about conveying a demographic portrait of a school district,
and more concerned with tools, data and methodologies that empower that leadership to determine 'where we are',
how things have changed and how things might change in the future and enhance educational opportunity; e.g. how should attendance zones be
structured to achieve the district's vision?
With the 'taking of Census 2010' now behind us, we are ready to steps toward accessing and using these data
... and prepare for Census 2020.
ProximityOne User Group
Join the ProximityOne User Group
to keep up-to-date with new developments relating to metros and component geography decision-making information resources.
Receive updates and access to tools and resources available only to members.
Use this form to join the User Group.
Support Using these Resources
Learn more about accessing and using demographic-economic data and related analytical tools.
Join us in a Data Analytics Lab session.
There is no fee for these one-hour Web sessions.
Each informal session is focused on a specific topic.
The open structure also provides for Q&A and discussion of application issues of interest to participants.
Additional Information
ProximityOne develops geodemographic-economic data and analytical tools and helps organizations knit together and use diverse data in a decision-making and analytical framework. We develop custom demographic/economic estimates and projections, develop geographic and geocoded address files, and assist with impact and geospatial analyses.
Wide-ranging organizations use our tools (software, data, methodologies) to analyze their own data integrated with other data.
Follow ProximityOne on Twitter at www.twitter.com/proximityone.
Contact us (888-364-7656) with questions about data covered in this section or to discuss
custom estimates, projections or analyses for your areas of interest.

 Census 2010 Demographics for Census 2000 Geography