
|
|
115th Congressional Districts: Analysis and Insights .. interpretative data analytics; tools, data & methods
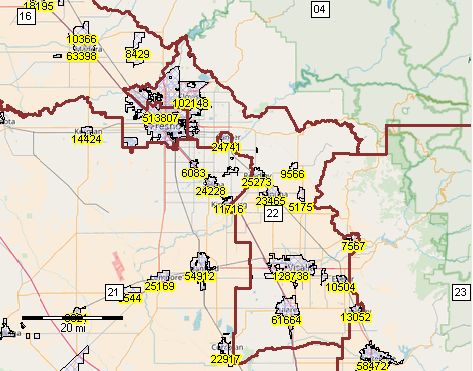
October 2018 .. this section is focused on 115th Congressional District geographic, demographic and economic patterns and characteristics. Use tools and data presented in this section to examine/analyze characteristics of one congressional district (CD) or a group of CDs based on state, party or other attribute. See related 116th Congress ... Jan 2019 - Dec 2020 - only Pennsylvania has significant boundary changes between 115th and 116th CDs. - 116th CD demographic-economic data will not be available until September 2019. - new 115th CD 2017 demographic-economic data were posted October 2018. General Demographics .. Social .. Economic .. Housing - the 116th Congress interactive table will show post election incumbency details in Nov 2018. Analyzing Individual Districts The following view shows California 115th CD 22 (Fresno & Tulare Counties) in context of adjacent districts and cities/places. Create variations of views similar to this for any CD, or drill-down into CD, using the CD115C GIS project. CDs shown with brown bold boundaries and white solid fill labels. Cities/places (see related blog) shown with blue cross-hatch pattern. Query used on city/place layer to only show places 5,000 population or more. Places show ACS 2016 total population as yellow labels. Click graphic for larger view. Larger view shows place names and clearer depiction of boundaries. Expand browser window for best quality view.  - View developed using CV XE GIS and related GIS project. - use the CD115C GIS project on your computer to create this and other views. See details. The cities/places shapefile/layer uses 2016 vintage city/place boundaries and includes all 29,322 U.S. cities/places. Create thematic pattern views using subject matter selected from the related ACS 2016 city/place interactive tables -- General Demographics .. Social .. Economic .. Housing Related Resources & Updates .. goto top
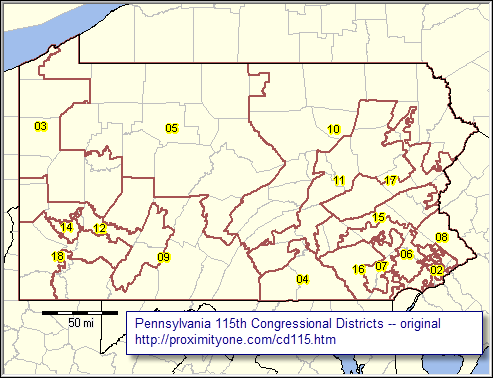
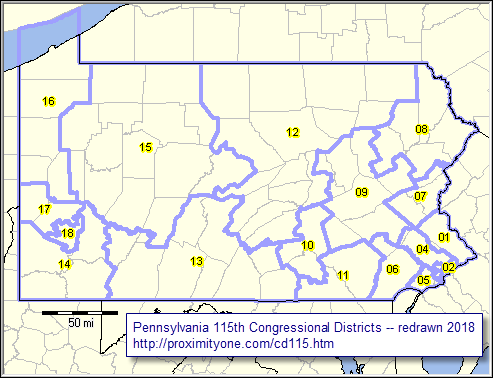
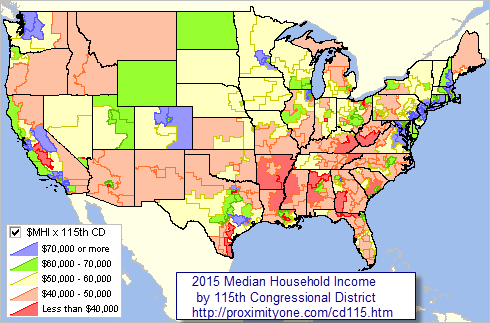
The following views show Pennsylvania 115th Congressional Districts in their gerrymandered configuration (old) and the redrawn configuration (February 2018, new). Counties shown with light gray boundary. Click graphic for larger view. Expand browser window for best quality view. Pennsylvania 115th CDs -- Old  - View developed using CV XE GIS and related GIS project. Pennsylvania 115th CDs -- New, redrawn February 2018  - View developed using CV XE GIS and related GIS project. See more about 115th Congressional District mapping and visual analysis using Geographic Information System (GIS) resources. Examining the 115th Congressional Districts • the 115th Congress runs from January 2017 through December 2018. • FL, MN, NC, VA have redistricted since the 114th CD vintage; .. some 115th CDs have new boundaries compared the 114th CDs. • As shown above PA redrew the gerrymandered districts in February 2018. • view, rank, compare CDs using the interactive table below. .. the table uses ACS 2016 data for 115th CDs and include incumbent attributes. .. examine districts by party affiliation. • use these more detailed 114th CD interactive tables .. data based on 2015 American Community Survey - ACS 2015. .. corresponding data for the 115th CDs from ACS 2016 released Sept 2017. • use the new GIS project including 114th & 115th CDs described below. .. create CD thematic and reference maps; .. examine CDs in context of other geography & subject matter. • join in Data Analytics Web sessions; CD/SLD analysis Visual Analysis of Congressional Districts The following views 1) provide insights into patterns among the 115th CDs and 2) illustrate how 114th to 115th geographic change can be examined. Use CV XE GIS software with the GIS project to create and examine alternative views. Patterns of Household Income by 115th Congressional District The following graphic shows the patterns of the median household income by 115th Congressional District based on the American Community Survey 2015 1-year estimates (ACS2015). The legend in the lower left shows data intervals and color/pattern assignment  .. view developed with ProximityOne CV XE GIS and related GIS project. Charlotte NC-SC Metro Area with 114th/115th Congressional District 12 The following graphic shows North Carolina CD 12 with 114th boundary (blue) and 115th boundary (pale yellow) and Charlotte metro bold brown boundary. Click graphic for larger view with more detail. Expand browser window for best view.  .. view developed using the CVGIS software. • View zoom-in to Charlotte city & Mecklenburg County. 115th Congressional District Demographic-Economic Characteristics interactive table Members of the Congressional District-State Legislative District (CDSLD) Group may use this table to access structured profiles for individual districts. Click here to join .. there is no cost. Using the table ... Click column header to sort; again to sort other direction. Click ShowAll button between queries to refresh. Usage notes below table. See more detailed CD115 tables. See related interactive tables Usage Notes • Click ShowAll between queries/filters. • State button to select by state. • Select by Party .. click Party button to select by incumbent party affiliation. • Code .. not active -- see for 116th Congress • Find StCD button; click ShowAll button first .. click Find StCD button to search StCD column for text in edit box. .. text entered in edit box is case sensitive. .. partial names are okay to use. .. click with default value to find "TX29" (no quotes) • Find Name button; click ShowAll button first .. click Find in Name button to search incumbent name for text in edit box. .. text entered in edit box is case sensitive. .. partial names are okay to use. .. click with default value to view all rows with "Smith" (no quotes) • Column sets .. click column set buttons to view only selected columns: .. Race/Origin columns .. Housing columns .. Income, housing value, educational attainment • Click ShowAll between queries/filters. Examples ... goto table View members of the Early Childhood, Elementary, and Secondary Education Subcommittee (ED14) - click ShowAll button - click Committee button - click ED14 in dropdown ... table refreshes with only ED14 member rows View median household income for these districts: - click "Income.Value.Educ" button ... table refreshes with only ED14 member rows and only selected columns. - click $MHI header cell (toggles sort on specific column ascending/descending) ... table refreshes sorted on $MHI for these districts. District with lowest $MHI: OH11 $90,800, highest $MHI: CA53 $461,600 Full dataset items The interactive table presented above includes selected items that are part of a larger dataset. The full list of dataset items are shown below. These data have already been integrated into the ready-to-use 115th CD GIS project. There are a larger set of subject matter available.
Learn more about accessing and using demographic-economic data and related analytical tools. Join us in a Data Analytics Lab session. There is no fee for these one-hour Web sessions. Each informal session is focused on a specific topic. The open structure also provides for Q&A and discussion of application issues of interest to participants. ProximityOne User Group Join the ProximityOne User Group to keep up-to-date with new developments relating to metros and component geography decision-making information resources. Receive updates and access to tools and resources available only to members. Use this form to join the User Group. Additional Information ProximityOne develops geodemographic-economic data and analytical tools and helps organizations knit together and use diverse data in a decision-making and analytical framework. We develop custom demographic/economic estimates and projections, develop geographic and geocoded address files, and assist with impact and geospatial analyses. Wide-ranging organizations use our tools (software, data, methodologies) to analyze their own data integrated with other data. Follow ProximityOne on Twitter at www.twitter.com/proximityone. Contact us (888-364-7656) with questions about data covered in this section or to discuss custom estimates, projections or analyses for your areas of interest. |
|
|