|
|
Related Sections - Applications Gallery - States - School Districts - Metros - Congressional District - Counties - Tracts/Neighborhoods - Block Groups - Census Blocks - ZIP Codes - Urban Areas Estimates-Projections - 2060 Demographic ... all county interactive table - 2030 Demographic-Economic - Single Year of Age GIS Thematic Mapping Visual Analysis Tools Ranking Tables National Scope Demographic Change 2000-2010 - States - Metros - Congressional District - School Districts - Counties - Cities/Places - Census Tracts |
Census 2010 Demographics for Census 2000 Geography
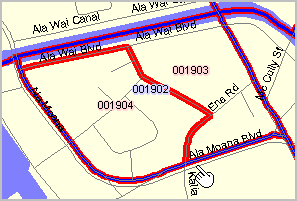
What is the Census 2010 population for a Census 2000 census tract of interest? Read on, the ranking table in this section provides the answer. How have neighborhoods, market areas and other sub-county areas changed since 2000? One answer is to use Census 2010 data ... but it may not be easy. Boundaries for many census tracts, the most widely used and important "small area geography," changed between Census 2000 and Census 2010. This makes it difficult to compare demographics for these sub-county building blocks between 2000 and 2010. Identifying and examining the nature of demographic change for some of the hottest areas of change can be challenging and elusive. This section is focused on relating Census 2000 tracts to Census 2010 tracts and Census 2010 demographics for Census 2000 census tracts. Availability of Census 2010 demographics for Census 2000 tract boundaries facilitates analysis of demographic change between 2000 and 2010 for county-wide, sub-county areas. More about census tracts ... about these tools/data. Census Blocks The process of developing Census 2010 demographics for Census 2000 geography starts at the census block level. Census 2010 block boundaries are often radically different from Census 2000 block boundaries in an area of interest. While the focus of this section is on census tracts, most Census 2010 Summary File 1 demographics, the most detailed demographic subject matter from Census 2010 at the census block level, are available for Census 2000 blocks. A Visual Example of Census Tract Change A simple example of Census 2000 to Census 2010 census tract
Often census tract boundary changes are much more complex. Individual Census 2000 census blocks are split and assigned to multiple Census 2010 tracts. Census Tract Demographic Patterns: 2000-2010 - interactive ranking table - click column header to sort; click again to sort other direction. - click ShowAll button between queries. Column Header Descriptions
About Census Tract Geography and Codes Census tracts are defined by the Census Bureau and organized as sub-county building blocks. Census tracts are small geographic areas, designed to average 4,000 population, but vary widely. The approximate 65,000 census tracts covering the U.S. wall-to-wall provide a good geographic granularity to meet many needs. Unchanging throughout the decade, census tract boundaries are subject to update for each decennial census though many will remain unchanged for Census 2010. Census tracts were first designed to be relatively homogeneous with respect to population characteristics, economic status, and living conditions. Over time, with demographic shifts, census tracts are often no longer so homogenous. However, tracts do closely approximate neighborhoods/neighborhood parts for many areas. The geographic size of census tracts varies widely depending on the density of settlement. Census tract boundaries are delineated with the intention of being maintained over many decades so that statistical comparisons can be made from decennial census to decennial census. Census tracts may be split due to population growth or combined as a result of substantial population decline. Census tracts were initially identified by a four-digit basic number and with a two-digit numeric suffix; for example, 6059.02. This version of the tract code is shown in column 3 in the ranking table. The decimal point separating the four-digit basic tract number from the two-digit suffix has been historically shown in printed reports and maps. Many census tracts do not have a suffix; in such cases, the suffix field is either left blank or is zero-filled. Census tract suffixes may range from .01 to .98. These optionally ways of assigning census tract geocodes or handles has led to some vagueness potentially creating problems in handling now common spreadsheet or CSV files. The national scope uniquely identifying tract geocode is the 11 character code shown in column 4 in the ranking table. The tract geocode is of the form SSCCCTTTTTT where SS is the FIPS state code, CCC is the county FIPS code and TTTTTT is the Census assigned tract code. In the tract geocode, there are never blanks or dots and lead zeroes are used for each the state, county and tract code components. This is the recommended tract unique identifier. Support Using these Resources Learn more about demographic economic data and related analytical tools. Join us in a Decision-Making Information Web session. There is no fee for these one-hour Web sessions. Each informal session is focused on a specific topic. The open structure also provides for Q&A and discussion of application issues of interest to participants. ProximityOne User Group Join the ProximityOne User Group to keep up-to-date with new developments relating to geographic-demographic-economic decision-making information resources. Receive updates and access to tools and resources available only to members. Use this form to join the User Group. There is no fee. Additional Information ProximityOne develops geographic-demographic-economic data and analytical tools and helps organizations knit together and use diverse data in a decision-making and analytical framework. We develop custom demographic/economic estimates and projections, develop geographic and geocoded address files, and assist with impact and geospatial analyses. Wide-ranging organizations use our tools (software, data, methodologies) to analyze their own data integrated with other data. Follow ProximityOne on Twitter at www.twitter.com/proximityone. Contact ProximityOne (888-364-7656) with questions about data covered in this section or to discuss custom estimates, projections or analyses for your areas of interest. |
|
|