
|
|
|
U.S. by County Population & Housing Patterns: 2000 to 2010
Almost two-thirds of the nation�s 3,143 counties gained population between 2000 and 2010. Use the interactive table below to view/compare/contrast county population and housing as of Census 2000, Census 2010 and change over the decade. See related updates: County Trends 2010-2015. County Population Change, 2000-2010 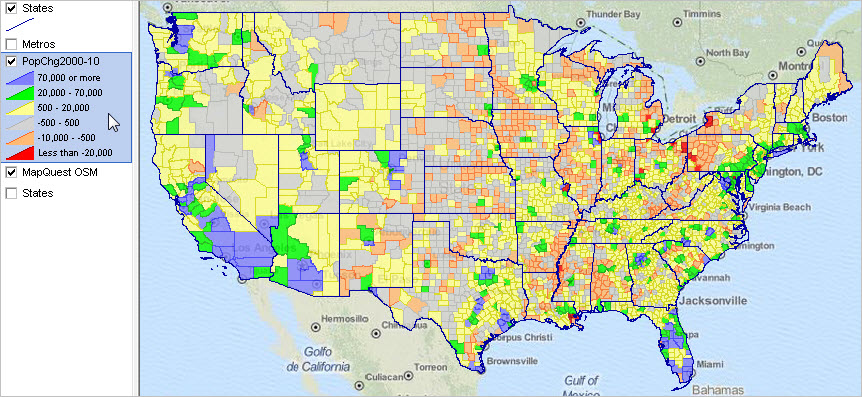 View created using CV XE GIS and related GIS project. Click graphic for larger view and additional details. ProximityOne User Group members ( join now, no fee) may use the software and GIS project to create similar views for any decade. Zoom into an area of interest. Add name, codes, or data values as labels. Add other geography. U.S. by County Population & Housing Patterns: 2000-2010 -- Interactive Table Click ShowAll button to refresh table and between queries. Click column header to sort; click again to sort other direction. See related Ranking Tables Main Page Column Headers and Usage Notes - St1 -- USPS State Code - St2 -- FIPS State Code - Cty -- County FIPS Code - CBSA -- CBSA/Metro Code - Population 2000 -- Population, Census 2000 - Population 2010 -- Population, Census 2010 - Population Chg0010 -- Population Change 2000-2010 - Population %Chg0010 -- Population Percent Change 2000-2010 - Housing Units 2000 -- Housing Units, Census 2000 - Housing Units 2010 -- Housing Units, Census 2010 - Housing Units Chg0010 -- Housing Units Change, 2000-2010 - Housing Units %Chg0010 -- Housing Units Percent Change, 2000-2010 Value of -999,999 and -999.00 indicate data NA. Related Data • County Demographic Projections to 2020 with age breakout • County Demographic Projections to 2060 • County population 1790 to 1990 by decade (xls) -- requires User Group ID. • County Demographics; 2000 & 2010 Support Using these Resources Learn more about accessing and using ACS data integrated with other data; examine characteristics and patterns for your study areas and applications. Join us in a Decision-Making Information Web session. There is no fee for these one-hour Web sessions. Each informal session is focused on a specific topic. The open structure also provides for Q&A and discussion of application issues of interest to participants. Additional Information ProximityOne develops geographic-demographic-economic data and analytical tools and helps organizations knit together and use diverse data in a decision-making and analytical framework. We develop custom demographic/economic estimates and projections, develop geographic and geocoded address files, and assist with impact and geospatial analyses. Wide-ranging organizations use our tools (software, data, methodologies) to analyze their own data integrated with other data. Follow ProximityOne on Twitter at www.twitter.com/proximityone. Contact us (888-364-7656) with questions about data covered in this section or to discuss custom estimates, projections or analyses for your areas of interest. |
|
|