CV XE GIS Home Page


  ProximityOne Main

  Census 2010 Main

  New Topics & Updates

  Products & Services

  S&O Metro Reports

  Situation & Outlook

  Related Sections
  - Applications Gallery
  - States
  - School Districts
  - Metros
  - Congressional
  - Counties
  - Census Tracts
  - Block Groups
  - Census Blocks
  - ZIP Codes
  - Urban Areas

  Estimates-Projections
  - County Interactive
  - 5-year Projections
  - Quarterly Projections
  - 2030 Projections
  - 2060 Projections

  CV XE GIS
    Visual Analysis

  Interactive Tables

  National Scope
  Demographic Change
  2000-2010
  - States
  - Metros
  - Congressional Dist
  - School Districts
  - Counties
  - Cities/Places
  - Census Tracts


Decision-Making Information
  ProximityOne
  information resources & solutions
  (888) DMI-SOLN
  (888) 364-7656


Put data to work more effectively.
Certificate in Data Analytics


Visual analysis with ProximityOne tools
click graphic for info; hover to pause

 
visually analyze clients/markets
site analysis using 1 mile radius

S1

$median household income
patterns by census tract - Houston

hover to pause

113th Congressional Districts

Click for info

US Asian Indian population 2010

Click for info

geocoded students and school
McKinney ISD, TX

Click for info

geocoded students and school
with tax parcels & streets

Click for info

high school attendance zones
with schools by type

Click for info

%high school graduates by
census tract - Puerto Rico

Click for info

Austin, TX MSA counties &
places 10K+ population markers

Click for info

Appalachia counties (green) &
coalfield counties (orange)

Click for info

China provinces percent urban &
cities (markers) by state plan

Click for info

Honolulu census tracts (red)
& census blocks


Central Park area NYC

Click for info

Kansas City Metro & Counties
Home Depot locations (markers)

Click for info

World Cities; focus on Spain

Click for info


Data Analytics Blog
Power of Combining Maps with Data

Support & Technical Assistance
help using these resources


Census 2010 Summary File 1
-- Detailed Demographics to the Census Block Level; 11+ Million Blocks

Analyzing extended demographics by census block and higher level geographic areas ... new data resources from Census 2010. The Census 2010 Summary File 1 (SF1) release was completed August 25, 2011.

The SF1 is the third major Census 2010 data resource following the Demographic Profile Summary File (DPSF) data released in May 2011 and following the P.L. 94-171 redistricting data released earlier in 2011.

The SF1 contains 100 percent data asked of all people and about every housing unit on topics such as sex, age, race, Hispanic origin, household relationship, household type, group quarters population, housing occupancy, and housing tenure. The SF1 is released as individual files for the U.S., each state, D.C., Puerto Rico and as a national summary file.

Data Scope, Content, Structure and Organization

  • Data Dictionary Table Matrix [DOC]
  • Table Shell [XLS]
  • Technical Documentation [PDF]

Access/Analysis Tools & Applications

10.19.17. 115th Congressional Districts Summary File 1 Update
    - release date 10/19/17
    - 115th Congressional Districts section - http://proximityone.com/cd115.htm
    - Technical documentation for corresponding 113th CD Census 2010 SF1 data
      ... no specific CD115 retabulation documentation
      ... file structure is the same; data retabulated for Florida, Minnesota, North Carolina and Virginia.
    - Data Access -- FTP Downloads

02.22.16. Analyzing County Group Quarters Population
... interactive table & GIS applications based partly on Census 2010 SF1
... see: http://proximityone.com/group_quarters..htm
      

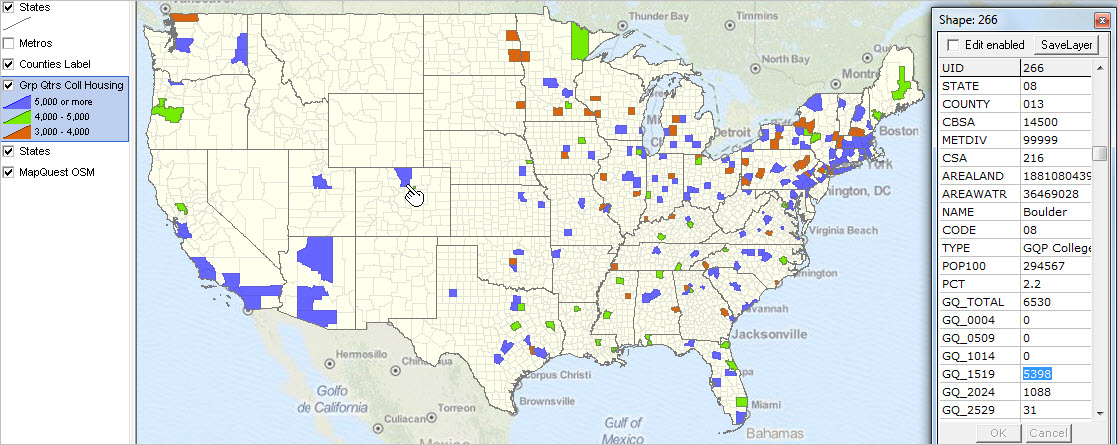
10.02.14. Mapping Urban/Rural Patterns by Census Block
... using TIGER 2014 and Census 2010 demographics & GIS applications
... see http://proximityone.com/mapping_census_blocks.htm
      

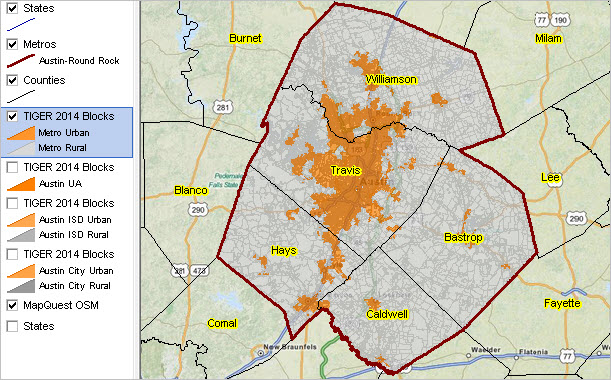
09.05.14. Examining Neighborhood Diversity Patterns
... examine your area; applications use Census 2010 SF1 data by tract
... see http://proximityone.com/neighborhood_diversity.htm
      

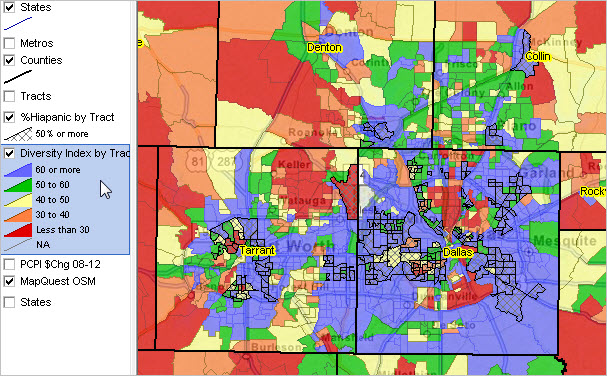
06.20.14. Demographic Economic Data Extraction
... Demographic Economic Data Extraction (DEDE) API tool
... extract Census 2010 and multi-sourced demographic economic data
... census block, block group and other geography

11.16.13. Using Census 2010 Summary File 1 Census Block Data
... Skip the downloads! Extract data for specified blocks and subject matter (at item level).
... Create dbase file for tabular processing and/or integration into shapefile for geospatial analysis.
... Use CV XE APIGateway to extract census block data from Census 2010 SF1.
... The no fee version of CV XE APIGateway supports this operation.
... See overview.

04.11.13. Census 2010 Summary File 1 Released for 113th Congressional Districts
... population by age, gender, race/origin; household type & relationship; group quarters
... housing units by own/rent/tenure; vacancy; related attributes
... retabulated for the congressional district boundaries of the 113th Congress
... 113th Congressional Districts: http://proximityone.com/cd113.htm
... check back for details on access

01.17.13. Mapping America's Urban Census Block Patterns
... While more than 80% of America's population is urban,
      far more than 80% America's geographic area is rural.
... National scope state by state map views.
... Map views based on Census 2010 Summary File 1 urban/rural update (September 2012).
... http://proximityone.com/urbanpopulation.htm

01.14.13. Summary File 1 Urban/Rural & Congressional District 113 Update
... Summary File 1 (urban/rural version) updated with new Congressional District 113 codes.
... National scope state by state shapefiles
... Shapefile dbf contains updated geographic segment and 150 demographic items
... Sample map views using these data:
      http://proximityone.com/cdgallery/guide/index.htm?ur_census_block.htm
... Contact us for additional information (mention CD113 SF1).

09.27.12. Summary File 1 Urban/Rural Update
... Summary File 1 updated with urban/rural codes and summary data
... superceded by 1/14/13 update (see above)

08.07.12. Use Census APIs to access Census 2010 via S&O Server
... use no fee S&O Server to access detailed Census 2010 Summary File 1 data
    and data for a wider range of geography down to block/block group level
... most tables/items from Census 2010 Summary File 1
... start using S&O Server today: http://proximityone.com/s&o/guide/server.htm

07.05.11. ZIP Code Demographics by City-Place: Using Census 2010 Summary File 1
Use the ranking table at http://proximityone.com/zip-place.htm to view a city/place by ZIP code and selected associated demographics for each ZIP code portion in that city/place. Examine how split ZIP codes are split by specific place and non-place areas. The data are also available as a national scope dataset.

Census 2010 ZIP Code Tabulation Areas (ZCTAs) and Places geographies are both comprised of sets of census blocks. Census block level data from the Census 2010 Summary File 1 (SF1) have been aggregated into ZIP code-Place parts to develop these data.

06.21.11. Tools for Analyzing Single Year of Age Demographics from Summary File 1
Single year of age data are are essential in many demographic analyses and the development of projections. The Census 2000, and now Census 2010, Summary File 1 (SF1) Table "PCT12" single year of age population data are widely used by many types of organizations for many types of applications. The PCT12 data uniquely provide access to "lowest common denominator" single year of age detail from under 1 year to 100 years of age for wide-ranging geographic areas enabling users to construct age cohort data not otherwise available. Table PCT12 is replicated for several race/ethnic combinations adding to analytical possibilities.

While the Census Bureau FactFinder (FF2) can be used to "call-up" and display/download the PCT12 data, it is difficult to use the data directly, or even open downloaded data with a tool such as Excel, and easily view the data. Effective usage challenges include:

  • Age detail iterated by gender is cumbersome to aggregate.
  • Comparison of aggregated gender data for one area to another is tedious.
  • Labeling age detail in Excel-type applications is time consuming and challenging.
  • Computing percentages requires additional steps.
  • Aggregating the data across areas of interest (e.g., 5 census tracts) requires time.

Illustrative Profiles
Click on links in upper right scroll box to view full U.S. profile (with California and Texas) and profiles for other selected areas. These profiles, and ranking table below, were developed with ProximityOne Situation & Outlook software using the DPFS database.

Note that in comparison to the DPSF data:
  • These profiles show a small subset of the scope of demographic subject matter contained in the SF1 data.
  • These subject matter items may be presented at the census block
    and any higher level geographic summary area for which Census 2010 data are tabulated using the SF1 data.

Develop similar comparative analysis profiles for any set of geographies in DPSF/SF1 dataset. Contact us for more information (mention SF1).

Detail Available in SF1 Not Previously Available
  • Single year of age by sex
  • More detail on children, including adopted, stepchildren and grandchildren
  • Race and Hispanic origin of householder
  • More detail on household relationships
  • Group quarters population by sex, age and group quarters type
  • Housing tenure (rented or owned) by age, household type, race and Hispanic origin of householder
  • Mortgage status of owned housing units

Counts about previously unreleased race and Hispanic or Latino origin groups are also available, including:
  • American Indian and Alaska Native tribal groupings, such as Cheyenne, Navajo and Yup'ik
  • Asian groups, such as Bangladeshi, Hmong and Pakistani
  • Hispanic origin groups, such as Argentinean, Colombian and Guatemalan
  • Native Hawaiian and Other Pacific Islander groups, such as Fijian, Marshallese and Tongan


ProximityOne User Group
Join the ProximityOne User Group to keep up-to-date with new developments relating to metros and component geography decision-making information resources. Receive updates and access to tools and resources available only to members. Use this form to join the User Group.

Support Using these Resources
Learn more about accessing and using demographic-economic data and related analytical tools. Join us in a Data Analytics Lab session. There is no fee for these one-hour Web sessions. Each informal session is focused on a specific topic. The open structure also provides for Q&A and discussion of application issues of interest to participants.

Additional Information
ProximityOne develops geodemographic-economic data and analytical tools and helps organizations knit together and use diverse data in a decision-making and analytical framework. We develop custom demographic/economic estimates and projections, develop geographic and geocoded address files, and assist with impact and geospatial analyses. Wide-ranging organizations use our tools (software, data, methodologies) to analyze their own data integrated with other data. Follow ProximityOne on Twitter at www.twitter.com/proximityone. Contact us (888-364-7656) with questions about data covered in this section or to discuss custom estimates, projections or analyses for your areas of interest.


Copyright © . ProximityOne. All Rights Reserved.
Sitemap | Contact Us | News