|
|
|
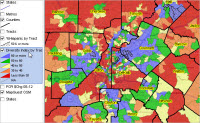
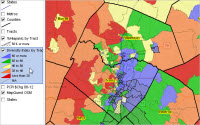
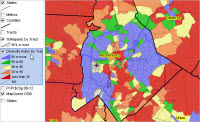
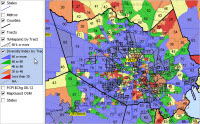
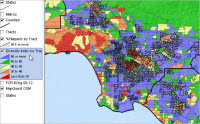
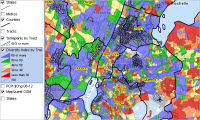
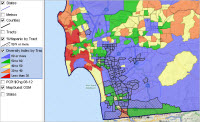
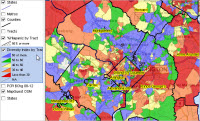
Population race/ethnic diversity varies widely by neighborhood in the United States. This section reviews use of tools that you can use to examine patterns of neighborhood race/ethnic diversity for anywhere in the United States. There are many types of neighborhood diversity (economic, age, etc.); we examine just one here -- diversity based on race/ethnicity. Using the tools and resources described in this section, you can also examine many other types of neighborhood diversity, or simply sub-county demographic-economic characteristics. Neighborhood Diversity Index The diversity index measures the degree of racial and ethnic diversity of the population. The percentage of each race (White, Black, American Indian/Alaska Native, Asian, Native Hawaiian) and Hispanic origin/ethnicity are used to calculate the chance that any two people are from different groups. The index ranges from 0 (no diversity) to 100 (highest diversity). The diversity index is computed for each census tract using data from Census 2010 Summary File 1 Table P5. Variation in Neighborhood Diversity Census tract 06001437701 in Alameda County, CA has the highest diversity index (88). Of the approximate 73,000 census tracts, there are more than 800 tracts with a diversity index above 80 (highly diverse). There are more than 8,000 tracts with a diversity index below 10 (little diversity). Visual Patterns of Neighborhood Diversity We illustrate use of CV XE GIS with associated GIS project to visually examine patterns of diversity by census tract. We extracted the Census 2010 Table 5 data using the Demographic Economic Data Extraction API tool and then integrated those data into a U.S. by census tract shapefile. See more about the GIS project. Click graphics at right to view diversity patterns for selected regions. Dallas, TX Area Diversity Patterns Neighborhood/Census Tract Census tracts are colored based on value of the diversity index. See color patterns assigned based on diversity index values as shown in legend at left of the map. Blue tracts are most diverse; red tracts are least diverse. Tracts shown with black cross-hatched pattern are tracts with 50-percent or more Hispanic population. 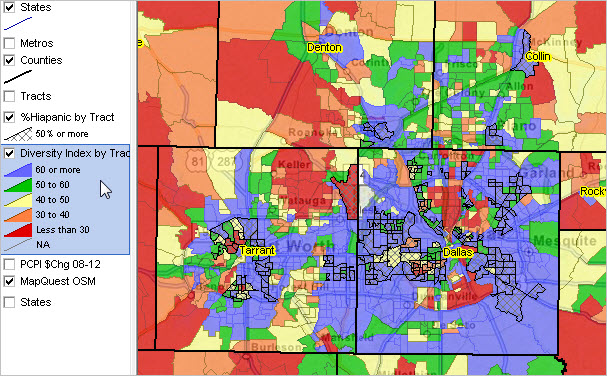 Click graphic for larger view Washington, DC Region Diversity Patterns by Census Tract Similar to the Dallas view, but note how different the patterns are. Click on the graphic to see the larger view with more details. In the larger view, the identify tool is used to display a mini-profile for a selected tract. Details about this census tract and mini-profile content are shown in the table below.  Click graphic for larger view Alexandria, VA; Washington, DC Region Zoom-in Diversity Patterns by Census Tract This view shows a zoom-in to Alexandria city shown in the view above. The view of Alexandria shows census tracts with black boundary and labeled with the diversity index. 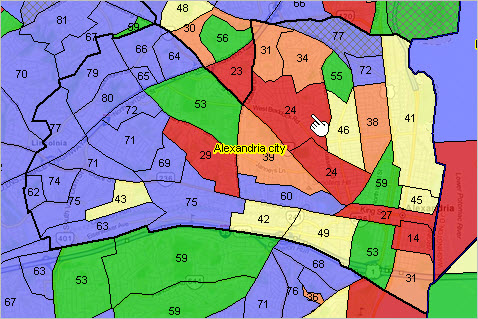 Illustrative Table P5 Mini-Profile Census 2010 Summary File 1 Table P5 items for census tract 51-510-200900 are shown in the table below. Table P5 contains 17 data items for each tract, P0050001 through P0050017. As shown here, the total Census 2010 population of this tract was 4,693. The total non-Hispanic population was 4,534. The relatively low size of the Hispanic population suggests that this tract will have less diversity than others.
Census 2010 SF1 Table P5 Census 2010 Summary File 1 Table P5 items for census tract 51-510-200900 is shown below.
Using the GIS Resources The Geographic Information System GIS project/files and software used to develop views shown in this section are available at no fee to members of the ProximityOne User Group. Zoom to you own areas of interest. Change labeling/colors/appearance. Add other geography. Select from other wide-ranging demographic-economic data. Join now; no fees to participate. Support Using these Resources Learn more about accessing and using demographic-economic data and related analytical tools. Join us in a Data Analytics Lab session. There is no fee for these one-hour Web sessions. Each informal session is focused on a specific topic. The open structure also provides for Q&A and discussion of application issues of interest to participants. ProximityOne User Group Join the ProximityOne User Group to keep up-to-date with new developments relating to metros and component geography decision-making information resources. Receive updates and access to tools and resources available only to members. Use this form to join the User Group. Additional Information ProximityOne develops geodemographic-economic data and analytical tools and helps organizations knit together and use diverse data in a decision-making and analytical framework. We develop custom demographic/economic estimates and projections, develop geographic and geocoded address files, and assist with impact and geospatial analyses. Wide-ranging organizations use our tools (software, data, methodologies) to analyze their own data integrated with other data. Follow ProximityOne on Twitter at www.twitter.com/proximityone. Contact us (888-364-7656) with questions about data covered in this section or to discuss custom estimates, projections or analyses for your areas of interest. |
|
|