|
|
|
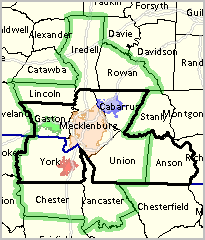
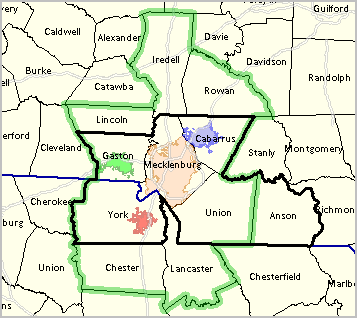
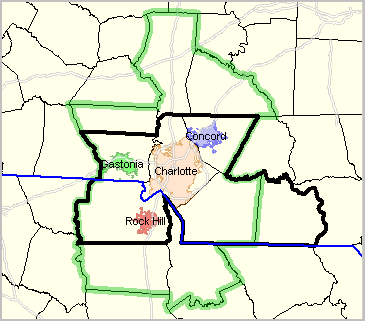
... resources to examine characteristics of places of population concentration -- America's more than 29,000 incorporated and census designated places in the 50 states and D.C. Use the interactive table in this section view/rank/compare characteristics of the cities/places and how they are changing. Post-census population estimates are included in the table. The table provides a means to examine places designated as principal cities (1,233) in the the new metropolitan areas. See details about examining metro principal cities. See more about cities/places below. Cities with 5,000+ Population  - Click for larger view/names Visual Analysis of City/Place Patterns Use the CVXE GIS Visual Library to examine characteristics of city/places in context with related geography and multi-sourced demographic-economic attributes. The map at right shows the Charlotte-Concord-Gastonia, NC-SC MSA illustrates use of the CVXE Visual Library: five county Census 2010 vintage and the ten county 2013 vintage. Click map for larger views and details. Examine related illustrative GIS/mapping applications focused on educational attainment, patterns of economic prosperity and population distribution in the Gallery section. A partial list of city/school district Gallery sections may be accessed using the links shown in the scroll box above the map at right. Selected City/Place Geographic-Demographic-Economic Updates ... scroll section
05.24.19. City/Place Population Patterns & Trends: 2010-2018
... annual population estimates for all cities; 2010-2018 ... see http://proximityone.com/places2018.htm ... interactive table & GIS tools 04.05.19. City/Place Vintage January 1, 2018 Boundary Files/Shapefiles ... Based on TIGER/Line 2018 ... integrate into your GIS/mapping application. 02.19.19. City/Place ACS 2017 Demographic-Economic Interactive Tables ... Based on ACS 2017 5-year estimates ... Includes all 29,000+ cities/places; includes CBSA/metro code ... General Demographics ... Social ... Economic ... Housing Characteristics 06.07.18. City/Place Population Patterns & Trends: 2010-2017 ... annual population estimates for all cities; 2010-2017 ... interactive table & GIS tools ... see http://proximityone.com/places2017.htm Patterns of City Population Growth %Change 2010-2017  01.27.18. City/Place Demographic-Economic Interactive Tables ... Based on ACS 2016 5-year estimates ... Includes all 29,000+ cities/places; includes CBSA/metro code ... General Demographics ... Social ... Economic ... Housing Characteristics 06.17.17. America's Communities Program ... demographic-economic profiles for America's Cities ... annual demographic trends; extended demographic-economic attributes ... side-by-side comparison with county and state ... see http://proximityone.com/acp.htm 05.27.17. City/Place Population Patterns & Trends: 2010-2016 ... annual population estimates for all cities; 2010-2016 ... interactive table & GIS tools ... see http://proximityone.com/places2016.htm Patterns of City Population Growth %Change 2010-2016  05.20.17. Relating ZIP Code Areas to Cities/Places ... geography & population ... interactive table & GIS tools ... see http://proximityone.com/zcta-place.htm 03.23.17. City/Place Demographic-Economic Interactive Tables Based on ACS 2015 5-year estimates Include all 29,000+ cities/places; includes CBSA/metro code ... General Demographics ... Social ... Economic ... Housing Characteristics 05.28.16. City/Place Population Patterns & Trends: 2010-2015 ... annual population estimates for all cities; 2010-2015 ... interactive table -- http://proximityone.com/places2015.htm 05.24.16. City/Place Demographic-Economic Interactive Tables Based on ACS 2014 5-year estimates Include all 29,000+ cities/places; principal city records/rows include CBSA/metro code ... General Demographics ... Social ... Economic ... Housing Characteristics 05.18.16. City/Place Data Analytics and Demographic-Economic Data ... view reports & tables; create state by city/place data files ... state-by-state demographic-economic characteristics and patterns ... select a state: http://proximityone.com/metro_reports.htm 05.12.16. Census Tract-City-County Relationship Interactive Table ... 72,000+ tracts equivalenced to 29,000+ cities/places (and counties) ... interactive table: view, sort, query, locate geographic relationships & codes ... see: http://proximityone.com/tract_place.htm 04.20.16. Access City/Place Characteristics in Context of Associated Metro ... each/all metropolitan area Situation & Outlook reports; continuously updated ... select a metro: http://proximityone.com/metro_reports.htm 02.15.14. City/Place Demographic-Economic Interactive Tables Based on ACS 2012 5-year estimates Include all 29,000+ cities/places; principal city records/rows include CBSA/metro code ... General Demographics ... Social ... Economic ... Housing 02.14.14. Principal Cities of Metropolitan Areas ... Examining Principal Cities 09.23.13. ACS 2012 Demographic-Economic Updates ... new American Community Survey (ACS) 2012 1-year estimates - demographic-economic updates for each cities/places 65,000 population or more ... use the interactive table to examine demographic-economic patterns - see http://proximityone.com/places_acs12.htm 05.31.13. City, County, State Daytime Population ... examine workers living/working in area; population change due to commuting; employment/residence ratio ... view, rank, compare cities, counties and states; interactive ranking table ... see http://proximityone.com/daytime_population.htm 12.16.12. City/Place Demographic-Economic Ranking Tables: All Cities/Places ... several hundred (600+) most widely used subject matter items; all 29,500+ cities/places ... General Demographics -- http://proximityone.com/pl11dp1.htm ... Social Characteristics -- http://proximityone.com/pl11dp2.htm ... Economic Characteristics -- http://proximityone.com/pl11dp3.htm ... Housing Characteristics -- http://proximityone.com/pl11dp4.htm 10.08.12. City/Place Demographic-Economic Ranking Tables: Places 65,000 Population+ ... several hundred (600+) most widely used subject matter items; all 29,500+ cities/places examine in context with US, states, counties, school districts ... ... General Demographics -- http://proximityone.com/acs2011dp1.htm ... Social Characteristics -- http://proximityone.com/acs2011dp2.htm ... Economic Characteristics -- http://proximityone.com/acs2011dp3.htm ... Housing Characteristics -- http://proximityone.com/acs2011dp4.htm ZIP Code Demographics by City-Place ... Census 2010 census block demographics aggregated to ZIP Code and ZIP Code part by city/place and for non-city/place area ... use interactive table to examine ZIP Codes by city/place and associated demographics ... see ZIP Code Demographics by City-Place Historical City/Places & Demographics -- 1790-1990 ... see Historical City/Places & Demographics -- 1790-1990 City/Place Geographic-Demographic-Economic Characteristics Table includes multi-sourced data for all Census 2010 cities/places in the 50 states & D.C. See usage notes below ranking table. See related interactive tables. Rank on any column by clicking column header; click again to sort other direction. Mouse-over column header to view item description. Usage Notes • Click on a column header to sort on that column; click column header again to sort in other direction. • Click ShowAll button to show all areas and restore full set of data view; this resets to start-up view. • Click State (dropdown below table) to view places in a selected state (click ShowAll between selections). • Click Metro Principal Cities (dropdown below table) to view places that are metro principal cities (click ShowAll between selections). • Find by Name: key in partial area name in text box to right of Find-in-Name button to filter for only Census Designated Places enter CDP in text box (case sensitive). then click button to locate all matches (case sensitive). • Navigate across rows/vertically in table: click in table on cell and arrow/page up/down or use scroll bar at right of table. • See related ranking tables. CBSA Code/Name List
10100 Aberdeen, SD MISA
10140 Aberdeen, WA MISA 10180 Abilene, TX MSA 10220 Ada, OK MISA 10260 Adjuntas, PR MISA 10300 Adrian, MI MISA 10380 Aguadilla-Isabela, PR MSA 10420 Akron, OH MSA 10460 Alamogordo, NM MISA 10500 Albany, GA MSA 10540 Albany, OR MSA 10580 Albany-Schenectady-Troy, NY MSA 10620 Albemarle, NC MISA 10660 Albert Lea, MN MISA 10700 Albertville, AL MISA 10740 Albuquerque, NM MSA 10780 Alexandria, LA MSA 10820 Alexandria, MN MISA 10860 Alice, TX MISA 10900 Allentown-Bethlehem-Easton, PA-NJ MSA 10940 Alma, MI MISA 10980 Alpena, MI MISA 11020 Altoona, PA MSA 11060 Altus, OK MISA 11100 Amarillo, TX MSA 11140 Americus, GA MISA 11180 Ames, IA MSA 11220 Amsterdam, NY MISA 11260 Anchorage, AK MSA 11380 Andrews, TX MISA 11420 Angola, IN MISA 11460 Ann Arbor, MI MSA 11500 Anniston-Oxford-Jacksonville, AL MSA 11540 Appleton, WI MSA 11580 Arcadia, FL MISA 11620 Ardmore, OK MISA 11640 Arecibo, PR MSA 11660 Arkadelphia, AR MISA 11680 Arkansas City-Winfield, KS MISA 11700 Asheville, NC MSA 11740 Ashland, OH MISA 11780 Ashtabula, OH MISA 11820 Astoria, OR MISA 11860 Atchison, KS MISA 11900 Athens, OH MISA 11940 Athens, TN MISA 11980 Athens, TX MISA 12020 Athens-Clarke County, GA MSA 12060 Atlanta-Sandy Springs-Roswell, GA MSA 12100 Atlantic City-Hammonton, NJ MSA 12140 Auburn, IN MISA 12180 Auburn, NY MISA 12220 Auburn-Opelika, AL MSA 12260 Augusta-Richmond County, GA-SC MSA 12300 Augusta-Waterville, ME MISA 12380 Austin, MN MISA 12420 Austin-Round Rock, TX MSA 12460 Bainbridge, GA MISA 12540 Bakersfield, CA MSA 12580 Baltimore-Columbia-Towson, MD MSA 12620 Bangor, ME MSA 12660 Baraboo, WI MISA 12680 Bardstown, KY MISA 12700 Barnstable Town, MA MSA 12740 Barre, VT MISA 12780 Bartlesville, OK MISA 12820 Bastrop, LA MISA 12860 Batavia, NY MISA 12900 Batesville, AR MISA 12940 Baton Rouge, LA MSA 12980 Battle Creek, MI MSA 13020 Bay City, MI MSA 13060 Bay City, TX MISA 13100 Beatrice, NE MISA 13140 Beaumont-Port Arthur, TX MSA 13180 Beaver Dam, WI MISA 13220 Beckley, WV MSA 13260 Bedford, IN MISA 13300 Beeville, TX MISA 13340 Bellefontaine, OH MISA 13380 Bellingham, WA MSA 13420 Bemidji, MN MISA 13460 Bend-Redmond, OR MSA 13500 Bennettsville, SC MISA 13540 Bennington, VT MISA 13620 Berlin, NH-VT MISA 13660 Big Rapids, MI MISA 13700 Big Spring, TX MISA 13720 Big Stone Gap, VA MISA 13740 Billings, MT MSA 13780 Binghamton, NY MSA 13820 Birmingham-Hoover, AL MSA 13900 Bismarck, NO MSA 13940 Blackfoot, ID MISA 13980 Blacksburg-Christiansburg-Radford, VA MSA 14010 Bloomington, IL MSA 14020 Bloomington, IN MSA 14100 Bloomsburg-Berwick, PA MSA 14140 Bluefield, WV-VA MISA 14180 Blytheville, AR MISA 14220 Bogalusa, LA MISA 14260 Boise City, ID MSA 14340 Boone, IA MISA 14380 Boone, NC MISA 14420 Borger, TX MISA 14460 Boston-Cambridge-Newton, MA-NH MSA 14500 Boulder, CO MSA 14540 Bowling Green, KY MSA 14580 Bozeman, MT MISA 14620 Bradford, PA MISA 14660 Brainerd, MN MISA 14700 Branson, MO MISA 14720 Breckenridge, CO MISA 14740 Bremerton-Silverdale, WA MSA 14780 Brenham, TX MISA 14820 Brevard, NC MISA 14860 Bridgeport-Stamford-Norwalk, CT MSA 15020 Brookhaven, MS MISA 15060 Brookings, OR MISA 15100 Brookings, SD MISA 15180 Brownsville-Harlingen, TX MSA 15220 Brownwood, TX MISA 15260 Brunswick, GA MSA 15340 Bucyrus, OH MISA 15380 Buffalo-Cheektowaga-Niagara Falls, NY MSA 15420 Burley, ID MISA 15460 Burlington, IA-IL MISA 15500 Burlington, NC MSA 15540 Burlington-South Burlington, VT MSA 15580 Butte-Silver Bow, MT MISA 15620 Cadillac, MI MISA 15660 Calhoun, GA MISA 15680 California-Lexington Park, MD MSA 15700 Cambridge, MD MISA 15740 Cambridge, OH MISA 15780 Camden, AR MISA 15820 Campbellsville, KY MISA 15860 Calion City, CO MISA 15900 Canton, IL MISA 15940 Canton-Massillon, OH MSA 15980 Cape Coral-Fort Myers, FL MSA 16020 Cape Girardeau, MO-IL MSA 16060 Carbondale-Marion, IL MSA 16100 Carlsbad-Artesia, NM MISA 16180 Carson City, NV MSA 16220 Casper, WY MSA 16260 Cedar City, UT MISA 16300 Cedar Rapids, IA MSA 16340 Cedartown, GA MISA 16380 Celina, OH MISA 16460 Centralia, IL MISA 16500 Centralia, WA MISA 16540 Chambersburg-Waynesboro, PA MSA 16580 Champaign-Urbana, IL MSA 16620 Charleston, WV MSA 16660 Charleston-Mattoon, IL MISA 16700 Charleston-North Charleston, SC MSA 16740 Charlotte-Concord-Gastonia, NC-SC MSA 16820 Charlottesville, VA MSA 16860 Chattanooga, TN-GA MSA 16940 Cheyenne, WY MSA 16980 Chicago-Naperville-Elgin, IL-IN-WI MSA 17020 Chico, CA MSA 17060 Chillicothe, OH MISA 17140 Cincinnati, OH-KY-IN MSA 17200 Claremont-Lebanon, NH-VT MISA 17220 Clarksburg, WV MISA 17260 Clarksdale, MS MISA 17300 Clarksville, TN-KY MSA 17340 Clearlake, CA MISA 17380 Cleveland, MS MISA 17420 Cleveland, TN MSA 17460 Cleveland-Elyria, OH MSA 17500 Clewiston, FL MISA 17540 Clinton, IA MISA 17580 Clovis, NM MISA 17620 Coamo, PR MISA 17640 Coco, PR MISA 17660 Coeur d'Alene, ID MSA 17700 Coffeyville, KS MISA 17740 Coldwater, MI MISA 17780 College Station-Bryan, TX MSA 17820 Colorado Springs, CO MSA 17860 Columbia, MO MSA 17900 Columbia, SC MSA 17980 Columbus, GA-AL MSA 18020 Columbus, IN MSA 18060 Columbus, MS MISA 18100 Columbus, NE MISA 18140 Columbus, OH MSA 18180 Concord, NH MISA 18220 Connersville, IN MISA 18260 Cookeville, TN MISA 18300 Coos Bay, OR MISA 18380 Cordele, GA MISA 18420 Corinth, MS MISA 18460 Cornelia, GA MISA 18500 Corning, NY MISA 18580 Corpus Christi, TX MSA 18620 Corsicana, TX MISA 18660 Cortland, NY MISA 18700 Corvallis, OR MSA 18740 Coshocton, OH MISA 18780 Craig, CO MISA 18820 Crawfordsville, IN MISA 18860 Crescent City, CA MISA 18880 Crestview-Fort Walton Beach-Destin, FL MSA 18900 Crossville, TN MISA 18980 Cullman, AL MISA 19000 Cullowhee, NC MISA 19060 Cumberland, MD-WV MSA 19100 Dallas-Fort Worth-Arlington, TX MSA 19140 Dalton, GA MSA 19180 Danville, IL MSA 19220 Danville, KY MISA 19260 Danville, VA MISA 19300 Daphne-Fairhope-Foley, AL MSA 19340 Davenport-Moline-Rock Island, IA-IL MSA 19380 Dayton, OH MSA 19420 Dayton, TN MISA 19460 Decatur, AL MSA 19500 Decatur, IL MSA 19540 Decatur, IN MISA 19580 Defiance, OH MISA 19620 Del Rio, TX MISA 19660 Deltona-Daytona Beach-Ormond Beach, FL MSA 19700 Deming, NM MISA 19740 Denver-Aurora-Lakewood, CO MSA 19760 DeRidder, LA MISA 19780 Des Moines-West Des Moines, IA MSA 19820 Detroit-Warren-Dearborn, MI MSA 19860 Dickinson, ND MISA 19940 Dixon, IL MISA 19980 Dodge City, KS MISA 20020 Dothan, AL MSA 20060 Douglas, GA MISA 20100 Dover, DE MSA 20140 Dublin, GA MISA 20180 DuBois, PA MISA 20220 Dubuque, IA MSA 20260 Duluth, MN-WI MSA 20300 Dumas, TX MISA 20340 Duncan, OK MISA 20380 Dunn, NC MISA 20420 Durango, CO MISA 20460 Durant, OK MISA 20500 Durham-Chapel Hill, NC MSA 20540 Dyersburg, TN MISA 20580 Eagle Pass, TX MISA 20660 Easton, MD MISA 20700 East Stroudsburg, PA MSA 20740 Eau Claire, WI MSA 20780 Edwards, CO MISA 20820 Effingham, IL MISA 20900 EI Campo, TX MISA 20940 EI Centro, CA MSA 20980 EI Dorado, AR MISA 21020 Elizabeth City, NC MISA 21060 Elizabethtown-Fort Knox, KY MSA 21120 Elk City, OK MISA 21140 Elkhart-Goshen, I N MSA 21180 Elkins, WV MISA 21220 Elko, NV MISA 21260 Ellensburg, WA MISA 21300 Elmira, NY MSA 21340 EI Paso, TX MSA 21380 Emporia, KS MISA 21420 Enid, OK MISA 21460 Enterprise, AL MISA 21500 Erie, PA MSA 21540 Escanaba, MI MISA 21580 Espanola, NM MISA 21660 Eugene, OR MSA 21700 Eureka-Arcata-Fortuna, CA MISA 21740 Evanston, WY MISA 21780 Evansville, IN-KY MSA 21820 Fairbanks, AK MSA 21840 Fairfield, IA MISA 21900 Fairmont, WV MISA 21980 Fallon, NV MISA 22020 Fargo, ND-MN MSA 22060 Faribault-Northfield, MN MISA 22100 Farmington, MO MISA 22140 Farmington, NM MSA 22180 Fayetteville, NC MSA 22220 Fayetteville-Springdale-Rogers, AR-MO MSA 22260 Fergus Falls, MN MISA 22280 Fernley, NV MISA 22300 Findlay, OH MISA 22340 Fitzgerald, GA MISA 22380 Flagstaff, AZ MSA 22420 Flint, MI MSA 22500 Florence, SC MSA 22520 Florence-Muscle Shoals, AL MSA 22540 Fond du Lac, WI MSA 22580 Forest City, NC MISA 22620 Forrest City, AR MISA 22660 Fort Collins, CO MSA 22700 Fort Dodge, IA MISA 22780 Fort Leonard Wood, MO MISA 22800 Fort Madison-Keokuk, IA-IL-MO MISA 22820 Fort Morgan, CO MISA 22860 Fort Polk South, LA MISA 22900 Fort Smith, AR-OK MSA 23060 Fort Wayne, IN MSA 23140 Frankfort, IN MISA 23180 Frankfort, KY MISA 23240 Fredericksburg, TX MISA 23300 Freeport, IL MISA 23340 Fremont, NE MISA 23380 Fremont, OH MISA 23420 Fresno, CA MSA 23460 Gadsden, AL MSA 23500 Gaffney, SC MISA 23540 Gainesville, FL MSA 23580 Gainesville, GA MSA 23620 Gainesville, TX MISA 23660 Galesburg, IL MISA 23700 Gallup, NM MISA 23780 Garden City, KS MISA 23820 Gardnerville Ranchos, NV MISA 23860 Georgetown, SC MISA 23900 Gettysburg, PA MSA 23940 Gillette, WY MISA 23980 Glasgow, KY MISA 24020 Glens Falls, NY MSA 24060 Glenwood Springs, CO MISA 24100 Gloversville, NY MISA 24140 Goldsboro, NC MSA 24220 Grand Forks, NO-MN MSA 24260 Grand Island, NE MSA 24300 Grand Junction, CO MSA 24340 Grand Rapids-Wyoming, MI MSA 24380 Grants, NM MISA 24420 Grants Pass, OR MSA 24460 Great Bend, KS MISA 24500 Great Falls, MT MSA 24540 Greeley, CO MSA 24580 Green Bay, WI MSA 24620 Greeneville, TN MISA 24640 Greenfield Town, MA MISA 24660 Greensboro-High Point, NC MSA 24700 Greensburg, IN MISA 24740 Greenville, MS MISA 24780 Greenville, NC MSA 24820 Greenville, OH MISA 24860 Greenville-Anderson-Mauldin, SC MSA 24900 Greenwood, MS MISA 24940 Greenwood, SC MISA 24980 Grenada, MS MISA 25020 Guayama, PR MSA 25060 Gulfport-Biloxi-Pascagoula, MS MSA 25100 Guymon, OK MISA 25180 Hagerstown-Martinsburg, MO-WV MSA 25200 Hailey, ID MISA 25220 Hammond, LA MSA 25260 Hanford-Corcoran, CA MSA 25300 Hannibal, MO MISA 25420 Harrisburg-Carlisle, PA MSA 25460 Harrison, AR MISA 25500 Harrisonburg, VA MSA 25540 Hartford-West Hartford-East Hartford, CT MSA 25580 Hastings, NE MISA 25620 Hattiesburg, MS MSA 25700 Hays, KS MISA 25720 Heber, UT MISA 25740 Helena, MT MISA 25760 Helena-West Helena, AR MISA 25780 Henderson, NC MISA 25820 Hereford, TX MISA 25840 Hermiston-Pendleton, OR MISA 25860 Hickory-Lenoir-Morganton, NC MSA 25880 Hillsdale, MI MISA 25900 Hilo, HI MISA 25940 Hilton Head Island-Bluffton-Beaufort, SC MSA 25980 Hinesville, GA MSA 26020 Hobbs, NM MISA 26090 Holland, MI MISA 26140 Homosassa Springs, FL MSA 26220 Hood River, OR MISA 26300 Hot Springs, AR MSA 26340 Houghton, MI MISA 26380 Houma-Thibodaux, LA MSA 26420 Houston-The Woodlands-Sugar Land, TX MSA 26460 Hudson, NY MISA 26500 Huntingdon, PA MISA 26540 Huntington, IN MISA 26580 Huntington-Ashland, WV-KY-OH MSA 26620 Huntsville, AL MSA 26660 Huntsville, TX MISA 26700 Huron, SO MISA 26740 Hutchinson, KS MISA 26780 Hutchinson, MN MISA 26820 Idaho Falls, ID MSA 26860 Indiana, PA MISA 26900 Indianapolis-Carmel-Anderson, IN MSA 26940 Indianola, MS MISA 26960 Ionia, MI MISA 26980 Iowa City, IA MSA 27020 Iron Mountain, MI-WI MISA 27060 Ithaca, NY MSA 27100 Jackson, MI MSA 27140 Jackson, MS MSA 27160 Jackson, OH MISA 27180 Jackson, TN MSA 27220 Jackson, WY-IO MISA 27260 Jacksonville, FL MSA 27300 Jacksonville, IL MISA 27340 Jacksonville, NC MSA 27380 Jacksonville, TX MISA 27420 Jamestown, NO MISA 27460 Jamestown-Ounkirk-Fredonia, NY MISA 27500 Janesville-Beloit, WI MSA 27540 Jasper, IN MISA 27580 Jayuya, PR MISA 27600 Jefferson, GA MISA 27620 Jefferson City, MO MSA 27700 Jesup, GA MISA 27740 Johnson City, TN MSA 27780 Johnstown, PA MSA 27860 Jonesboro, AR MSA 27900 Joplin, MO MSA 27920 Junction City, KS MISA 27940 Juneau, AK MISA 27980 Kahului-Wailuku-Lahaina, HI MSA 28020 Kalamazoo-Portage, MI MSA 28060 Kalispell, MT MISA 28100 Kankakee, IL MSA 28140 Kansas City, MO-KS MSA 28180 Kapaa, HI MISA 28260 Kearney, NE MISA 28300 Keene, NH MISA 28340 Kendallville, IN MISA 28380 Kennett, MO MISA 28420 KenneWick-Richland, WA MSA 28500 Kerrville, TX MISA 28540 Ketchikan, AK MISA 28580 Key West, FL MISA 28620 Kill Devil Hills, NC MISA 28660 Killeen-Temple, TX MSA 28700 Kingsport-Bristol-Bristol, TN-VA MSA 28740 Kingston, NY MSA 28780 Kingsville, TX MISA 28820 Kinston, NC MISA 28860 Kirksville, MO MISA 28900 Klamath Falls, OR MISA 28940 Knoxville, TN MSA 29020 Kokomo, IN MSA 29060 Laconia, NH MISA 29100 La Crosse-Onalaska, WI-MN MSA 29180 Lafayette, LA MSA 29200 Lafayette-West Lafayette, IN MSA 29260 La Grande, OR MISA 29300 LaGrange, GA MISA 29340 Lake Charles, LA MSA 29380 Lake City, FL MISA 29420 Lake Havasu City-Kingman, AZ MSA 29460 Lakeland-Winter Haven, FL MSA 29500 Lamesa, TX MISA 29540 Lancaster, PA MSA 29620 Lansing-East Lansing, MI MSA 29660 Laramie, WY MISA 29700 Laredo, TX MSA 29740 Las Cruces, NM MSA 29780 Las Vegas, NM MISA 29820 Las Vegas-Henderson-Paradise, NV MSA 29860 Laurel, MS MISA 29900 Laurinburg, NC MISA 29940 Lawrence, KS MSA 29980 Lawrenceburg, TN MISA 30020 Lawton, OK MSA 30060 Lebanon, MO MISA 30140 Lebanon, PA MSA 30220 Levelland, TX MISA 30260 Lewisburg, PA MISA 30280 Lewisburg, TN MISA 30300 Lewiston, ID-WA MSA 30340 Lewiston-Auburn, ME MSA 30380 Lewistown, PA MISA 30420 Lexington, NE MISA 30460 Lexington-Fayette, KY MSA 30580 Liberal, KS MISA 30620 Lima, OH MSA 30660 Lincoln, IL MISA 30700 Lincoln, NE MSA 30780 Little Rock-North Little Rock-Conway, AR MSA 30820 Lock Haven, PA MISA 30860 Logan, UT-ID MSA 30880 Logan, WV MISA 30900 Logansport, IN MISA 30940 London, KY MISA 30980 Longview, TX MSA 31020 Longview, WA MSA 31060 Los Alamos, NM MISA 31080 Los Angeles-Long Beach-Anaheim, CA MSA 31140 Louisville/Jefferson County, KY-IN MSA 31180 Lubbock, TX MSA 31220 Ludington, MI MISA 31260 Lufkin, TX MISA 31300 Lumberton, NC MISA 31340 Lynchburg, VA MSA 31380 Macomb, IL MISA 31420 Macon, GA MSA 31460 Madera, CA MSA 31500 Madison, IN MISA 31540 Madison, WI MSA 31580 Madisonville, KY MISA 31620 Magnolia, AR MISA 31660 Malone, NY MISA 31680 Malvern, AR MISA 31700 Manchester-Nashua, NH MSA 31740 Manhattan, KS MSA 31820 Manitowoc, WI MISA 31860 Mankato-North Mankato, MN MSA 31900 Mansfield, OH MSA 31930 Marietta, OH MISA 31940 Marinette, WI-MI MISA 31980 Marion, IN MISA 32000 Marion, NC MISA 32020 Marion, OH MISA 32100 Marquette, MI MISA 32140 Marshall, MN MISA 32180 Marshall, MO MISA 32220 Marshall, TX MISA 32260 Marshalltown, IA MISA 32280 Martin, TN MISA 32300 Martinsville, VA MISA 32340 Maryville, MO MISA 32380 Mason City, IA MISA 32420 Mayaguez, PR MSA 32460 Mayfield, KY MISA 32500 Maysville, KY MISA 32540 McAlester, OK MISA 32580 McAlien-Edinburg-Mission, TX MSA 32620 McComb, MS MISA 32660 McMinnville, TN MISA 32700 McPherson, KS MISA 32740 Meadville, PA MISA 32780 Medford, OR MSA 32820 Memphis, TN-MS-AR MSA 32860 Menomonie, WI MISA 32900 Merced, CA MSA 32940 Meridian, MS MISA 32980 Merrill, WI MISA 33020 Mexico, MO MISA 33060 Miami, OK MISA 33100 Miami-Fort Lauderdale-West Palm Beach, FL MSA 33140 Michigan City-La Porte, IN MSA 33180 Middlesborough, KY MISA 33220 Midland, MI MSA 33260 Midland, TX MSA 33300 Milledgeville, GA MISA 33340 Milwaukee-Waukesha-West Allis, WI MSA 33420 Mineral Wells, TX MISA 33460 Minneapolis-St. Paul-Bloomington, MN-WI MSA 33500 Minot, ND MISA 33540 Missoula, MT MSA 33580 Mitchell, SD MISA 33620 Moberly, MO MISA 33660 Mobile, AL MSA 33700 Modesto, CA MSA 33740 Monroe, LA MSA 33780 Monroe, MI MSA 33860 Montgomery, AL MSA 33940 Montrose, CO MISA 33980 Morehead City, NC MISA 34020 Morgan City, LA MISA 34060 Morgantown, WV MSA 34100 Morristown, TN MSA 34140 Moscow, ID MISA 34180 Moses Lake, WA MISA 34220 Moultrie, GA MISA 34260 Mountain Home, AR MISA 34300 Mountain Home, ID MISA 34340 Mount Airy, NC MISA 34380 Mount Pleasant, MI MISA 34420 Mount Pleasant, TX MISA 34460 Mount Sterling, KY MISA 34500 Mount Vernon, IL MISA 34540 Mount Vernon, OH MISA 34580 Mount Vernon-Anacortes, WA MSA 34620 Muncie, IN MSA 34660 Murray, KY MISA 34700 Muscatine, IA MISA 34740 Muskegon, MI MSA 34780 Muskogee, OK MISA 34820 Myrtle Beach-Conway-North Myrtle Beach, SC-NC MSA 34860 Nacogdoches, TX MISA 34900 Napa, CA MSA 34940 Naples-Immokalee-Marco Island, FL MSA 34980 Nashville-Davidson--Murfreesboro--Franklin, TN MSA 35020 Natchez, MS-LA MISA 35060 Natchitoches, LA MISA 35100 New Bern, NC MSA 35140 Newberry, SC MISA 35220 New Castle, IN MISA 35260 New Castle, PA MISA 35300 New Haven-Milford, CT MSA 35380 New Orleans-Metairie, LA MSA 35420 New Philadelphia-Dover, OH MISA 35440 Newport, OR MISA 35460 Newport, TN MISA 35500 Newton, IA MISA 35580 New Ulm, MN MISA 35620 New York-Newark-Jersey City, NY-NJ-PA MSA 35660 Niles-Benton Harbor, MI MSA 35700 Nogales, AZ MISA 35740 Norfolk, NE MISA 35820 North Platte, NE MISA 35840 North Port-Sarasota-Bradenton, FL MSA 35860 North Vernon, IN MISA 35900 North Wilkesboro, NC MISA 35940 Norwalk, OH MISA 35980 Norwich-New London, CT MSA 36020 Oak Harbor, WA MISA 36100 Ocala, FL MSA 36140 Ocean City, NJ MSA 36220 Odessa, TX MSA 36260 Ogden-Clearfield, UT MSA 36300 Ogdensburg-Massena, NY MISA 36340 Oil City, PA MISA 36380 Okeechobee, FL MISA 36420 Oklahoma City, OK MSA 36460 Olean, NY MISA 36500 Olympia-Tumwater, WA MSA 36540 Omaha-Council Bluffs, NE-IA MSA 36580 Oneonta, NY MISA 36620 Ontario, OR-ID MISA 36660 Opelousas, LA MISA 36700 Orangeburg, SC MISA 36740 Orlando-Kissimmee-Sanford, FL MSA 36780 Oshkosh-Neenah, WI MSA 36820 Oskaloosa, IA MISA 36830 Othello, WA MISA 36840 Ottawa, KS MISA 36860 Ottawa-Peru, IL MISA 36900 Ottumwa, IA MISA 36940 Owatonna, MN MISA 36980 Owensboro, KY MSA 37020 Owosso, MI MISA 37060 Oxford, MS MISA 37080 Oxford, NC MISA 37100 Oxnard-Thousand Oaks-Ventura, CA MSA 37120 Ozark, AL MISA 37140 Paducah, KY-IL MISA 37220 Pahrump, NV MISA 37260 Palatka, FL MISA 37300 Palestine, TX MISA 37340 Palm Bay-Melbourne-Titusville, FL MSA 37420 Pampa, TX MISA 37460 Panama City, FL MSA 37500 Paragould, AR MISA 37540 Paris, TN MISA 37580 Paris, TX MISA 37620 Parkersburg-Vienna, WV MSA 37660 Parsons, KS MISA 37740 Payson, AZ MISA 37780 Pecos, TX MISA 37860 Pensacola-Ferry Pass-Brent, FL MSA 37900 Peoria, IL MSA 37940 Peru, IN MISA 37980 Philadelphia-Camden-Wilmington, PA-NJ-DE-MD MSA 38060 Phoenix-Mesa-Scottsdale, AZ MSA 38100 Picayune, MS MISA 38180 Pierre, SO MISA 38220 Pine Bluff, AR MSA 38240 Pinehurst-Southern Pines, NC MISA 38260 Pittsburg, KS MISA 38300 Pittsburgh, PA MSA 38340 Pittsfield, MA MSA 38380 Plainview, TX MISA 38420 Platteville, WI MISA 38460 Plattsburgh, NY MISA 38500 Plymouth, IN MISA 38540 Pocatello, ID MSA 38580 Point Pleasant, WV-OH MISA 38620 Ponca City, OK MISA 38660 Ponce, PR MSA 38700 Pontiac, IL MISA 38740 Poplar Bluff, MO MISA 38780 Portales, NM MISA 38820 Port Angeles, WA MISA 38840 Port Clinton, OH MISA 38860 Portland-South Portland, ME MSA 38900 Portland-Vancouver-Hillsboro, OR-WA MSA 38920 Port Lavaca, TX MISA 38940 Port St. Lucie, FL MSA 39020 Portsmouth, OH MISA 39060 Pottsville, PA MISA 39140 Prescott, AZ MSA 39220 Price, UT MISA 39260 Prineville, OR MISA 39300 Providence-Warwick, RI-MA MSA 39340 Provo-Orem, UT MSA 39380 Pueblo, CO MSA 39420 Pullman, WA MISA 39460 Punta Gorda, FL MSA 39500 Quincy, IL-MO MISA 39540 Racine, WI MSA 39580 Raleigh, NC MSA 39660 Rapid City, SO MSA 39700 Raymondville, TX MISA 39740 Reading, PA MSA 39780 Red Bluff, CA MISA 39820 Redding, CA MSA 39860 Red Wing, MN MISA 39900 Reno, NV MSA 39940 Rexburg, ID MISA 39980 Richmond, IN MISA 40060 ichmond, VA MSA 40080 ichmond-Berea, KY MISA 40100 io Grande City, TX MISA 40140 iverside-San Bernardino-Ontario, CA MSA 40180 iverton, WY MISA 40220 oanoke, VA MSA 40260 Roanoke Rapids, NC MISA 40300 Rochelle, IL MISA 40340 Rochester, MN MSA 40380 Rochester, NY MSA 40420 Rockford, IL MSA 40460 Rockingham, NC MISA 40540 Rock Springs, WY MISA 40580 Rocky Mount, NC MSA 40620 Rolla, MO MISA 40660 Rome, GA MSA 40700 Roseburg, OR MISA 40740 Roswell, NM MISA 40780 Russellville, AR MISA 40820 Ruston, LA MISA 40860 Rutland, VT MISA 40900 Sacramento--Roseville--Arden-Arcade, CA MSA 40940 Safford, AZ MISA 40980 Saginaw, MI MSA 41060 St. Cloud, MN MSA 41100 St. George, UT MSA 41140 St. Joseph, MO-KS MSA 41180 St. Louis, MO-IL MSA 41220 St. Marys, GA MISA 41400 Salem, OH MISA 41420 Salem, OR MSA 41460 Salina, KS MISA 41500 Salinas, CA MSA 41540 Salisbury, MO-OE MSA 41620 Salt Lake City, UT MSA 41660 San Angelo, TX MSA 41700 San Antonio-New Braunfels, TX MSA 41740 San Diego-Carlsbad, CA MSA 41760 Sandpoint, ID MISA 41780 Sandusky, OH MISA 41820 Sanford, NC MISA 41860 San Francisco-Oakland-Hayward, CA MSA 41900 San German, PR MSA 41940 San Jose-Sunnyvale-Santa Clara, CA MSA 41980 San Juan-Carolina-Caguas, PR MSA 42020 San Luis Obispo-Paso Robles-Arroyo Grande, CA MSA 42100 Santa Cruz-Watsonville, CA MSA 42140 Santa Fe, NM MSA 42180 Santa Isabel, PR MISA 42200 Santa Maria-Santa Barbara, CA MSA 42220 Santa Rosa, CA MSA 42300 Sault Ste. Marie, MI MISA 42340 Savannah, GA MSA 42380 Sayre, PA MISA 42420 Scottsbluff, NE MISA 42460 Scottsboro, AL MISA 42540 Scranton--Wilkes-Barre--Hazleton, PA MSA 42620 Searcy, AR MISA 42660 Seattle-Tacoma-Bellevue, WA MSA 42680 Sebastian-Vero Beach, FL MSA 42700 Sebring, FL MSA 42740 Sedalia, MO MISA 42780 Selinsgrove, PA MISA 42820 Selma, AL MISA 42860 Seneca, SC MISA 42900 Seneca Falls, NY MISA 42940 Sevierville, TN MISA 42980 Seymour, IN MISA 43020 Shawano, WI MISA 43060 Shawnee, OK MISA 43100 Sheboygan, WI MSA 43140 Shelby, NC MISA 43180 Shelbyville, TN MISA 43220 Shelton, WA MISA 43260 Sheridan, WY MISA 43300 Sherman-Denison, TX MSA 43320 Show Low, AZ MISA 43340 Shreveport-Bossier City, LA MSA 43380 Sidney, OH MISA 43420 Sierra Vista-Douglas, AZ MSA 43460 Sikeston, MO MISA 43500 Silver City, NM MISA 43580 Sioux City, IA-NE-SD MSA 43620 Sioux Falls, SO MSA 43660 Snyder, TX MISA 43700 Somerset, KY MISA 43740 Somerset, PA MISA 43760 Sonora, CA MISA 43780 South Bend-Mishawaka, IN-MI MSA 43900 Spartanburg, SC MSA 43940 Spearfish, SO MISA 43980 Spencer, IA MISA 44020 Spirit Lake, IA MISA 44060 Spokane-Spokane Valley, WA MSA 44100 Springfield, IL MSA 44140 Springfield, MA MSA 44180 Springfield, MO MSA 44220 Springfield, OH MSA 44260 Starkville, MS MISA 44300 State College, PA MSA 44340 Statesboro, GA MISA 44420 Staunton-Waynesboro, VA MSA 44460 Steamboat Springs, CO MISA 44500 Stephenville, TX MISA 44540 Sterling, CO MISA 44580 Sterling, IL MISA 44620 Stevens Point, WI MISA 44660 Stillwater, OK MISA 44700 Stockton-Lodi, CA MSA 44740 Storm Lake, IA MISA 44780 Sturgis, MI MISA 44860 Sulphur Springs, TX MISA 44900 Summerville, GA MISA 44920 Summit Park, UT MISA 44940 Sumter, SC MSA 44980 Sunbury, PA MISA 45000 Susanville, CA MISA 45020 Sweetwater, TX MISA 45060 Syracuse, NY MSA 45140 Tahlequah, OK MISA 45180 Talladega-Sylacauga, AL MISA 45220 Tallahassee, FL MSA 45300 Tampa-St. Petersburg-Clearwater, FL MSA 45340 Taos, NM MISA 45380 Taylorville, IL MISA 45460 Terre Haute, IN MSA 45500 Texarkana, TX-AR MSA 45520 The Dalles, OR MISA 45540 The Villages, FL MSA 45580 Thomaston, GA MISA 45620 Thomasville, GA MISA 45660 Tiffin, OH MISA 45700 Tifton, GA MISA 45740 Toccoa, GA MISA 45780 Toledo, OH MSA 45820 Topeka, KS MSA 45860 Torrington, CT MISA 45900 Traverse City, MI MISA 45940 Trenton, NJ MSA 45980 Troy, AL MISA 46020 Truckee-Grass Valley, CA MISA 46060 Tucson, AZ MSA 46100 Tullahoma-Manchester, TN MISA 46140 Tulsa, OK MSA 46180 Tupelo, MS MISA 46220 Tuscaloosa, AL MSA 46300 Twin Falls, ID MISA 46340 Tyler, TX MSA 46380 Ukiah, CA MISA 46460 Union City, TN-KY MISA 46500 Urbana, OH MISA 46520 Urban Honolulu, HI MSA 46540 Utica-Rome, NY MSA 46620 Uvalde, TX MISA 46660 Valdosta, GA MSA 46700 Vallejo-Fairfield, CA MSA 46740 Valley, AL MISA 46780 Van Wert, OH MISA 46820 Vermillion, SD MISA 46860 Vernal, UT MISA 46900 Vernon, TX MISA 46980 Vicksburg, MS MISA 47020 Victoria, TX MSA 47080 Vidalia, GA MISA 47180 Vincennes, IN MISA 47220 Vineland-Bridgeton, NJ MSA 47240 Vineyard Haven, MA MISA 47260 Virginia Beach-Norfolk-Newport News, VA-NC MSA 47300 Visalia-Porterville, CA MSA 47340 Wabash, IN MISA 47380 Waco, TX MSA 47420 Wahpeton, ND-MN MISA 47460 Walla Walla, WA MSA 47540 Wapakoneta, OH MISA 47580 Warner Robins, GA MSA 47620 Warren, PA MISA 47660 Warrensburg, MO MISA 47700 Warsaw, IN MISA 47780 Washington, IN MISA 47820 Washington, NC MISA 47900 Washington-Arlington-Alexandria, DC-VA-MD-WV MSA 47920 Washington Court House, OH MISA 47940 Waterloo-Cedar Falls, IA MSA 47980 Watertown, SD MISA 48020 Watertown-Fort Atkinson, WI MISA 48060 Watertown-Fort Drum, NY MSA 48100 Wauchula, FL MISA 48140 Wausau, WI MSA 48180 Waycross, GA MISA 48220 Weatherford, OK MISA 48260 Weirton-Steubenville, WV-OH MSA 48300 Wenatchee, WA MSA 48460 West Plains, MO MISA 48540 Wheeling, WV-OH MSA 48580 Whitewater-Elkhorn, WI MISA 48620 Wichita, KS MSA 48660 Wichita Falls, TX MSA 48700 Williamsport, PA MSA 48780 Williston, ND MISA 48820 Willmar, MN MISA 48900 Wilmington, NC MSA 48940 Wilmington, OH MISA 48980 Wilson, NC MISA 49020 Winchester, VA-WV MSA 49080 Winnemucca, NV MISA 49100 Winona, MN MISA 49180 Winston-Salem, NC MSA 49220 Wisconsin Rapids-Marshfield, WI MISA 49260 Woodward, OK MISA 49300 Wooster, OH MISA 49340 Worcester, MA-CT MSA 49380 Worthington, MN MISA 49420 Yakima, WA MSA 49460 Yankton, SD MISA 49620 York-Hanover, PA MSA 49660 Youngstown-Warren-Boardman, OH-PA MSA 49700 Yuba City, CA MSA 49740 Yuma, AZ MSA 49780 Zanesville, OH MISA 49820 Zapata, TX MISA Items/Columns in Ranking Table Census 2010 Items • 1 Place Name -- city/place name • 2 St -- state postal abbreviation • 3 Code -- place code - 57: census designated place • 4 Type -- place type -- Legal/Statistical Area Description (LSAD) code • 5 Level -- summary level - value is 162 (incorporated places) or null - only 162 areas are estimated by Census under post-census estimates program • 6 Pop 2010 -- Census 2010 total population • 7 %Urban -- Census 2010 percent urban population • 8 Hsg 2010 -- Census 2010 total housing units • 9 AreaL -- land area, square miles, as of Census 2010 • 10 AreaW -- water area, square miles, as of Census 2010 Census Bureau Estimates - post-census estimates; not produced for Census Designated Places • 11 Pop 0710 -- Census Bureau total population estimate 7/1/10 (released July 2012) • 12 Pop 0711 -- Census Bureau total population estimate 7/1/11 (released July 2012) ACS 2011 5-year estimates • 13 Pop 09 -- ACS 2011 5 year total population estimate; centric to mid-2009 • 14 Md Age -- ACS 2011 5 year population median age estimate; centric to mid-2009 • 15 %White -- ACS 2011 5 year population percent White (of one race) estimate; centric to mid-2009 • 16 %Black -- ACS 2011 5 year population percent Black (of one race) estimate; centric to mid-2009 • 17 %AIAN -- ACS 2011 5 year population percent American Indian/Alaska Native (of one race) estimate; centric to mid-2009 • 18 %Asian -- ACS 2011 5 year population percent Asian (of one race) estimate; centric to mid-2009 • 19 %NHPI -- ACS 2011 5 year population percent Native Hawaiian/Pacific Islander (of one race) estimate; centric to mid-2009 • 20 %Hisp -- ACS 2011 5 year population percent Hispanic (of any race) estimate; centric to mid-2009 • 21 %GrdHS -- ACS 2011 5 year population 25 years and over percent high school graduate estimate; centric to mid-2009 • 22 %GrdColl -- ACS 2011 5 year population 25 years and over percent college graduate estimate; centric to mid-2009 • 23 $MHI -- ACS 2011 5 year median household income (dollars) estimate; centric to mid-2009 • 24 $MHV -- ACS 2011 5 year median housing value (dollars) estimate; centric to mid-2009 - top-coded at $1,000,000 OMB 2013 CBSA Designation for this place ... these columns active only for principal cities • 25 CBSA -- Core-Based Statistical Area (CBSA) code • 26 CBSAName -- CBSA Name • 27 CType -- CBSA type (MSA or MISA) Value of -1 in table cell indicates data not available. Selected Views -- Charlotte-Concord-Gastonia, NC-SC MSA with Principal Cities
Examining Characteristics of Principal Cities As of Census 2010, the population in principal cities of metros in the 50 states and D.C. was 108,513,218, 47.5% of the population in all cities/places (228,457,238). Follow these steps to view attributes of principal cities in a selected metro using the above ranking table above. 1. Click the ShowAll button below the ranking table. 2. Enter the CBSA code for the metro in the edit box to the right of the CBSA button below the ranking table. 3. Click the CBSA button. The table now shows a filtered view of only the principal cities in the selected CBSA. Using the default value of 16740 (the Charlotte-Concord-Gastonia, NC-SC MSA CBSA code), the following rows are now shown: 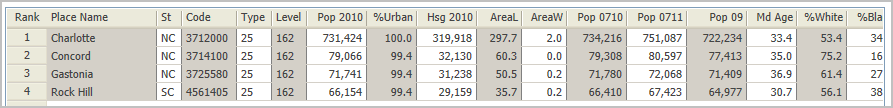
It is easy to compare attributes of these these four cities. Use the horizontal scroll bar to slide right to view additional columns: 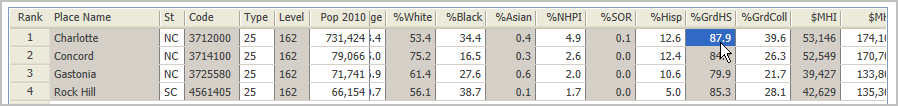
The graphic above shows that the percent high school graduates in Charlotte was 87.9% (based on ACS 2011 5 year estimate). Compare the high school graduation rate in Charlotte to the rate in the other principal cities. Cities & Places Cities and places, or more generally places, are geographic areas of population concentration. Incorporated places are political areas having certain governmental powers designated by the corresponding state. Unincorporated places, or Census Designated Places (CDPs), are statistical areas having no official standing and no governmental powers but are recognized as being areas of population concentration. Wide-ranging demographic-economic estimates are developed annually for the approximate 29,500 incorporated cities and CDPs based on the American Community Survey 5-year estimates. Incorporated Cities/Places. The legal designations, powers, and functions of incorporated places vary from state to state. Incorporated places include cities, towns (except in New England, New York, and Wisconsin), boroughs (except in Alaska where boroughs are treated as equivalents of counties and New York where five boroughs comprise New York City) and villages. Incorporated places can cross both county boundaries. Boundaries for incorporated cities are updated annually by the Census Bureau. Model-based population estimates are developed annually for incorporated cities. There are approximately 19,500 incorporated cities in the U.S. Census Designated Places. A Census Designated Place (CDP), is the statistical counterpart of incorporated places and are delineated to provide data for settled concentrations of population that identifiable by name but are not legally incorporated under the laws of the state in which they are located. CDPs are delineated cooperatively by state and local officials and the Census Bureau. Current estimates are not developed by the Census Bureau for CDPs. Principal Cities. One or more principal cities are designated within each Metropolitan Statistical Area (MSA) and Micropolitan Statistical Area (MISA). The term "principal city" is defined in the OMB "Standards for Delineating Metropolitan and Micropolitan Statistical Areas." A principal city is an OMB designation applied to one or more incorporated places and/or census designated places (CDPs). The OMB standards designate a Principal City (or Cities) of a Core-Based Statistical Area (CBSA) as determined by: a) The largest incorporated place with a 2010 Census population of at least 10,000 in the CBSA or, if no incorporated place of at least 10,000 population is present in the CBSA, the largest incorporated place or census designated place in the CBSA; and b) Any additional incorporated place or census designated place with a 2010 Census population of at least 250,000 or in which 100,000 or more persons work; and c) Any additional incorporated place or census designated place with a 2010 Census population of at least 50,000, but less than 250,000, and in which the number of workers working in the place meets or exceeds the number of workers living in the place; and d) Any additional incorporated place or census designated place with a 2010 Census population of at least 10,000, but less than 50,000, and at least one-third the population size of the largest place, and in which the number of workers working in the place meets or exceeds the number of workers living in the place. ProximityOne User Group Join the ProximityOne User Group to keep up-to-date with new developments relating to metros and component geography decision-making information resources. Receive updates and access to tools and resources available only to members. Use this form to join the User Group. Support Using these Resources Learn more about accessing and using demographic-economic data and related analytical tools. Join us in a Data Analytics Lab session. There is no fee for these one-hour Web sessions. Each informal session is focused on a specific topic. The open structure also provides for Q&A and discussion of application issues of interest to participants. Additional Information ProximityOne develops geodemographic-economic data and analytical tools and helps organizations knit together and use diverse data in a decision-making and analytical framework. We develop custom demographic/economic estimates and projections, develop geographic and geocoded address files, and assist with impact and geospatial analyses. Wide-ranging organizations use our tools (software, data, methodologies) to analyze their own data integrated with other data. Follow ProximityOne on Twitter at www.twitter.com/proximityone. Contact us (888-364-7656) with questions about data covered in this section or to discuss custom estimates, projections or analyses for your areas of interest. |
|
|