
|
|
|
City/Place General Demographic Characteristics -- ACS 2015 Age and Race/Origin Characteristics
.. general demographic characteristics of cities and places are essential for business development, market analysis, planning, economic development, program management and general awareness of patterns and trends. This section provides access to data and tools to examine these data for all cities/places in the U.S. This annual update includes characteristics for 29,321 cities/places based on ACS 2015 data. See corresponding previous year data. ProximityOne develops tools and data to update and analyze city/community demographic-economic characteristics, patterns and trends. Contact us for more information about custom studies and data integration services. January 2018 ... this section updated with ACS 2016 data; see updated section. Four pages/tables: • General Demographics -- this section • Social Characteristics • Economic Characteristics • Housing Characteristics Related: • City/Place GeoDemographics Main Section • Annual City/Place Population Estimates & Trends • Similar ACS tables: Census Tracts | ZIP Codes | State, Metro & County Selected general demographic characteristics ... from interactive table below ... get corresponding data for state/metro of interest.
Visual Analysis of City/Place Population Dynamics Use the CV XE GIS software with city/place GIS project to examine characteristics of city/place population. The following view shows patterns of population percent change by city in the Charlotte, NC/SC metro area. 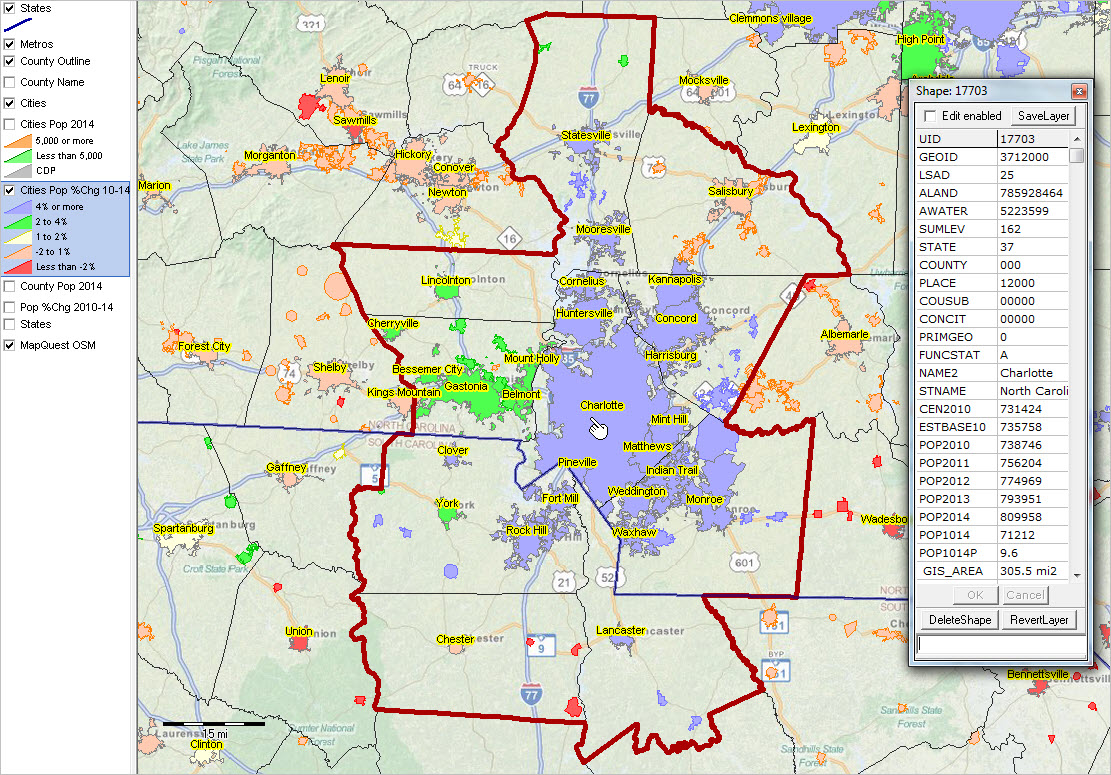 ... view developed using the CV XE GIS software. ... click map for larger view and details including city name. Using the Interactive Table Use the interactive table below to view, query, rank, compare general demographics of the population, households and families for these areas. The scroll box shown below lists each of the subject matter items available for each area via the ranking table. In the subject matter items scrollbox, subject matter items are organized into to mini-tables with related items. The number at the left of the subject matter item is also used as the short name for the subject matter item in the column header in the ranking table. General Demographics Items
AGE AND GENDER
D001 Total population D002 Male D003 Female D004 Under 5 years D005 5 to 9 years D006 10 to 14 years D007 15 to 19 years D008 20 to 24 years D009 25 to 34 years D010 35 to 44 years D011 45 to 54 years D012 55 to 59 years D013 60 to 64 years D014 65 to 74 years D015 75 to 84 years D016 85 years and over D017 Median age (years) D018 18 years and over D019 21 years and over D020 62 years and over D021 65 years and over D022 18 years and over D023 Male D024 Female D025 65 years and over D026 Male D027 Female RACE D028 Total population D029 One race D030 Two or more races D031 One race D032 White D033 Black or African American D034 American Indian and Alaska Native D035 Cherokee tribal grouping D036 Chippewa tribal grouping D037 Navajo tribal grouping D038 Sioux tribal grouping D039 Asian D040 Asian Indian D041 Chinese D042 Filipino D043 Japanese D044 Korean D045 Vietnamese D046 Other Asian D047 Native Hawaiian and Other Pacific Islander D048 Native Hawaiian D049 Guamanian or Chamorro D050 Samoan D051 Other Pacific Islander D052 Some other race D053 Two or more races D054 White and Black or African American D055 White and American Indian and Alaska Native D056 White and Asian D057 Black or African American and American Indian and Alaska Native Race alone or in combination with one or more other races D058 Total population D059 White D060 Black or African American D061 American Indian and Alaska Native D062 Asian D063 Native Hawaiian and Other Pacific Islander D064 Some other race HISPANIC OR LATINO AND RACE D065 Total population D066 Hispanic or Latino (of any race) D067 Mexican D068 Puerto Rican D069 Cuban D070 Other Hispanic or Latino D071 Not Hispanic or Latino D072 White alone D073 Black or African American alone D074 American Indian and Alaska Native alone D075 Asian alone D076 Native Hawaiian and Other Pacific Islander alone D077 Some other race alone D078 Two or more races D079 Two races including Some other race D080 Two races excluding Some other race, and Three or more races D081 Total housing units CITIZENSHIP D082 Citizen, 18 and Over Population D083 Citizen, 18 and Over Population -- Male D084 Citizen, 18 and Over Population -- Female City/Place General Demographics interactive table ACS 2015 5-year estimates Click ShowAll button between Find/Queries. Use mouseover on column header to view column description. See usage notes below table. See related tables -- http://proximityone.com/rankingtables.htm. Usage Notes • If table not showing any rows; click ShowAll button below table. • Use vertical and horizontal scroll bars to navigate up/down or left/right. • Adjust column widths using column divider between header cells. • CBSA> button -- use to select districts in a specified metro/CBSA .. get metro 5-character code here .. paste the 5-character metro code in the edit box to right of CBSA> button. .. overwriting the value 19100. .. click the CBSA> button ... table refreshes with all areas in specified metro. • Find Name> button -- use to select area based on exact spelling of partial name in column 1. .. Key in exact up/low case spelling of partial name of area in the edit box to right of Find Name> button. .. overwriting the value Dallas. .. click the Find Name> button ... table refreshes with all areaa with matched spelling in column 1. • Group1 selected columns .. D001 Total population .. D031 One race .. D032 One race -- White .. D033 One race -- Black or African American .. D034 One race -- American Indian and Alaska Native .. D039 One race -- Asian .. D047 One race -- Native Hawaiian and Other Pacific Islander .. D052 One race -- Some other race .. D053 Two or more races .. D066 Not Hispanic or Latino .. click "All columns" button to restore view to all columns. • All items are estimates for five year period 2011-2015. • Click ShowAll button between specific area queries. • Cells with negative value could not be estimated (for this geography and this time frame). Selecting Cities within a Metro/CBSA Proceed with these steps to view cities within a selected metro/CBSA: • Click ShowAll button below table. • Click Group 1 .. button below table. • Click the CBSA> button (using the default Dallas metro CBSA code 19100). • Click the D039 column header; click again to sort in other direction. Examine a metro of interest -- get metro 5-character code here .. • Click ShowAll button below table. • Click Group 1 .. button below table. • Paste the 5-character metro code in the edit box to right of CBSA> button. .. overwriting the value 19100. • Click the CBSA> button. • Click the D039 column header; click again to sort in other direction. Use find codes/names to determine census tract, city/place, school district etc. geocode/area name based on address. Importance of Demographic-Economic Data The importance of understanding the demographic-economic make-up and trends can hardly be overstated. Community and educational challenges and opportunities are shaped by demographic-economic dynamics. Only by knowing "where we are" can we develop the most effective plans for improvement. The American Community Survey provides "richer" demographic-economic characteristics for national scope wide-ranging geographic areas. While Census 2010 provides data similar to those items in the General Demographics section, only ACS sourced data provide details on topics such as income and poverty, labor force and employment, housing value and costs, educational participation and attainment, language spoken at home, among many related items. The approximate 600 items accessible via the dataset are supplemented by a wide range of additional subject matter. These data are updated annually in December of each year for each/all political/statistical areas, including school districts, census tracts, ZIP code areas and block groups. ProximityOne User Group Join the ProximityOne User Group to keep up-to-date with new developments relating to metros and component geography decision-making information resources. Receive updates and access to tools and resources available only to members. Use this form to join the User Group. Support Using these Resources Learn more about accessing and using demographic-economic data and related analytical tools. Join us in a Data Analytics Lab session. There is no fee for these one-hour Web sessions. Each informal session is focused on a specific topic. The open structure also provides for Q&A and discussion of application issues of interest to participants. Additional Information ProximityOne develops geodemographic-economic data and analytical tools and helps organizations knit together and use diverse data in a decision-making and analytical framework. We develop custom demographic/economic estimates and projections, develop geographic and geocoded address files, and assist with impact and geospatial analyses. Wide-ranging organizations use our tools (software, data, methodologies) to analyze their own data integrated with other data. Follow ProximityOne on Twitter at www.twitter.com/proximityone. Contact us (888-364-7656) with questions about data covered in this section or to discuss custom estimates, projections or analyses for your areas of interest. |
|
|