
|
|
|
May 2016. The change in U.S. city population from 2010 to 2015 ranged from growth of 357,979 in New York City to a decline of in Detroit, MI. New York City is actually five counties; the next largest city growth was Houston, TX with a 181,463 population gain. See cities with largest growth or decline using the interactive table below. The July 1, 2015 Census Bureau model-based estimates for the U.S. 19,505 incorporated cities show a total population of 202,066,769 compared to 192,179,239 as of Census 2010. These areas are incorporated cities as recognized by their corresponding state governments and granted certain governmental rights and responsibilities. ProximityOne integrates these estimates, with related data, in models to develop projections, examine change and assess the impact of change. Largest 10 Cities -- the Million-Plus Population Cities The largest 10 cities in 2015, shown by this graphic taken from the interactive table below, are also the set of cities having 1 million or more population. 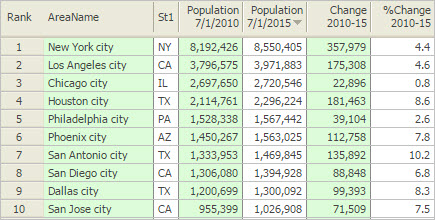
City/Place Demographics in Context • State & Regional Demographic-Economic Characteristics & Patterns .. individual state sections with analytical tools & data access to block level • Metropolitan Area Situation & Outlook .. continuously updated characteristics, patterns & trends for each/all metros Using the Interactive Table Use the interactive table in this section to view, rank, query and compare cities of interest. View the list of cities with the largest 2015 population by dbl-clicking the header cell "Population 7/1/2015" in the table. Place a state query on the table to select cities in a state of interest and click the header cell "Population 7/1/2015" to view cities in that state ranked by size. Choose other columns to view other relationships. Visual Analysis of City/Place Population Dynamics Use the CV XE GIS software with city/place GIS project to examine characteristics of city/place population, 2010-2015. The following view shows patterns of population percent change, 2010-15, by city in the Charlotte, NC/SC metro area. 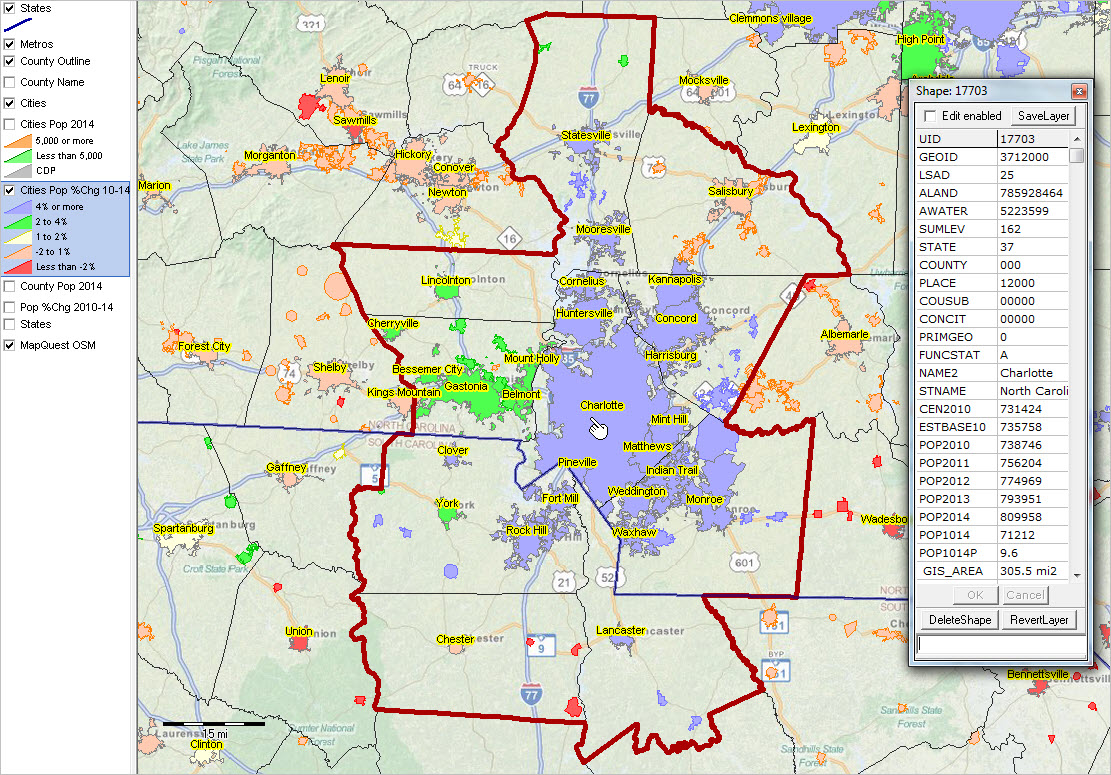 ... view developed using the CV XE GIS software. ... click map for larger view and details including city name. The Largest 10 Cities based on 2015 Population Locations of the largest 10 cities based on 2015 population are shown in the following graphic as red marker.  1. New York, NY 2. Los Angeles, CA 3. Chicago, IL 4. Houston, TX 5. Philadelphia, PA 6. Phoenix, AX 7. San Antonio, TX 8. San Diego, CA 9. Dallas, TX 10. San Jose, CA City/Place Population Estimates & Trends Interactive Table: 2010-2015 See usage notes below ranking table. See related ranking tables. This table contains all states, all 3,142 counties, 19,505 cities and 21,168 county sub-divisions. Rank on any column by clicking column header; use mouse-over on column header to view description of item. Use horizontal bar, slide right, to view 2015 population, 2010-15 change and percent change. .. use buttons below table for selective columns view. Usage Notes • Click on a column header to sort on that column; click column header again to sort in other direction. • Click ShowAll button to show all areas and restore full set of data view; this resets to start-up view. • Click State (dropdown below table) to view places in a selected state (click ShowAll between selections). • Find by Name: key in partial area name in text box to right of Find-in-Name button then click button to locate all matches (case sensitive). • Navigate across rows/vertically in table: click in table on cell and arrow/page up/down or use scroll bar at right of table. • See related ranking tables. Incorporated Cities/Places The legal designations, powers, and functions of incorporated places vary from state to state. Incorporated places include cities, towns (except in New England, New York, and Wisconsin where towns are county administrative subdivision), boroughs (except in Alaska where boroughs are treated as equivalents of counties and New York where five boroughs comprise New York City) and villages. Incorporated places can cross both county boundaries. Population estimates for incorporated places in this section are for the city with boundaries as defined as of January 1, 2015. ProximityOne User Group Join the ProximityOne User Group to keep up-to-date with new developments relating to metros and component geography decision-making information resources. Receive updates and access to tools and resources available only to members. Use this form to join the User Group. Support Using these Resources Learn more about accessing and using demographic-economic data and related analytical tools. Join us in a Data Analytics Lab session. There is no fee for these one-hour Web sessions. Each informal session is focused on a specific topic. The open structure also provides for Q&A and discussion of application issues of interest to participants. Additional Information ProximityOne develops geodemographic-economic data and analytical tools and helps organizations knit together and use diverse data in a decision-making and analytical framework. We develop custom demographic/economic estimates and projections, develop geographic and geocoded address files, and assist with impact and geospatial analyses. Wide-ranging organizations use our tools (software, data, methodologies) to analyze their own data integrated with other data. Follow ProximityOne on Twitter at www.twitter.com/proximityone. Contact us (888-364-7656) with questions about data covered in this section or to discuss custom estimates, projections or analyses for your areas of interest. |
|
|