|
|
Dallas, TX -- Demographic-Economic Characteristics & Patterns
Decision-Making Information

|
ProximityOne
information resources & solutions
(888) DMI-SOLN
(888) 364-7656
|
Visual analysis with ProximityOne tools
click graphic for info; hover to pause
|
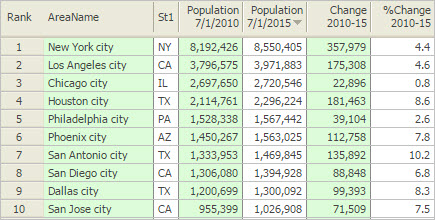
Select a Largest 10 City
... click a link below
1. New York, NY
2. Los Angeles, CA
3. Chicago, IL
4. Houston, TX
5. Philadelphia, PA
6. Phoenix, AX
7. San Antonio, TX
8. San Diego, CA
9. Dallas, TX
10. San Jose, CA
|
Ranked 9th among all U.S. cities based on 2015 population, the population of Dallas city, TX changed from 1,197,792 in 2010 to 1,300,092 in 2015 (102,300 or 8.5%).
The population of the U.S. overall changed from 308,758,105 in 2010 to 321,418,820 in 2015 (12,660,715 or 4.1%).
Examine population characteristics and trends of the city of
Dallas in context of other cities and counties using the
interactive table.
Dallas is a principal city of the
Dallas-Fort Worth-Arlington, TX Metropolitan Statistical Area
(CBSA 19100).
This section reviews selected geographic, demographic and economic characteristics of the city of Dallas.
Dallas City in Regional Context
Dallas city is shown as green-fill semi-transparent area.
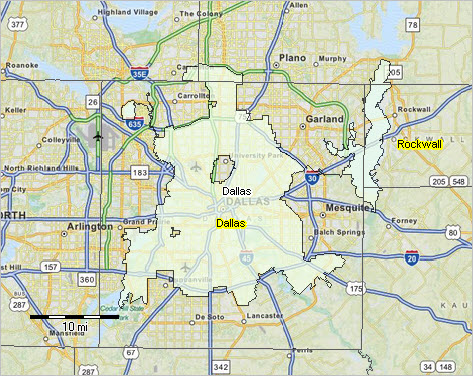
... view developed using the CV XE GIS software.
... click map for larger view.
• Dallas Urbanized Area (orange fill pattern below city layer)
.. about urbanized areas
Examining Characteristics, Patterns and Trends of Dallas
Demographic-economic data are presented below for the city.
See about these data and city geography below in this section.
Comparing Dallas to Other Areas -- Using the Interactive Table
Use the interactive table in the related section to view, rank, query and compare annual population estimates for states, cities, counties and sub-county areas of interest.
Dallas, TX Demographic-Economic Characteristics
Annual demographic-economic estimates are available for all geographies for areas of 65,000 population or more from the American Community Survey
(ACS). Data shown in the table show characteristics of the city for 2012 and 2014.
| | -- ACS 2012 1 year -- | -- ACS 2014 1 year -- | -- Change 2012-14 --
| | | Value | Percent | Value | Percent | Value | Percent |
| Total Population | 1,241,108 | 100.00 | 1,281,031 | 100.00 | 39,923 | 3.22 |
| Male | 626,205 | 50.46 | 637,627 | 49.77 | 11,422 | 1.82 |
| Female | 614,903 | 49.54 | 643,404 | 50.23 | 28,501 | 4.64 |
| Age | | | | | | |
| Under 5 years | 100,561 | 8.10 | 104,419 | 8.15 | 3,858 | 3.84 |
| 5-9 years | 90,615 | 7.30 | 97,139 | 7.58 | 6,524 | 7.20 |
| 10-14 years | 81,893 | 6.60 | 86,647 | 6.76 | 4,754 | 5.81 |
| 15-19 years | 73,820 | 5.95 | 77,608 | 6.06 | 3,788 | 5.13 |
| 20-24 years | 97,121 | 7.83 | 100,474 | 7.84 | 3,353 | 3.45 |
| 25-34 years | 231,183 | 18.63 | 232,734 | 18.17 | 1,551 | 0.67 |
| 35-44 years | 175,262 | 14.12 | 182,175 | 14.22 | 6,913 | 3.94 |
| 45-54 years | 153,962 | 12.41 | 155,657 | 12.15 | 1,695 | 1.10 |
| 55-59 years | 61,990 | 4.99 | 66,423 | 5.19 | 4,433 | 7.15 |
| 60-64 years | 58,072 | 4.68 | 56,977 | 4.45 | -1,095 | -1.89 |
| 65-74 years | 65,684 | 5.29 | 70,295 | 5.49 | 4,611 | 7.02 |
| 75-84 years | 34,076 | 2.75 | 35,814 | 2.80 | 1,738 | 5.10 |
| 85+ years | 16,869 | 1.36 | 14,669 | 1.15 | -2,200 | -13.04 |
| Median age | 32.40 | | 32.40 | | 0.00 | 0.00 |
| Race/Origin | | | | | | |
| One Race | 1,216,453 | 98.01 | 1,249,737 | 97.56 | 33,284 | 2.74 |
| White | 738,525 | 59.51 | 792,715 | 61.88 | 54,190 | 7.34 |
| Black/African American | 309,069 | 24.90 | 310,838 | 24.26 | 1,769 | 0.57 |
| American Indian/Alaska Native | 2,858 | 0.23 | 4,510 | 0.35 | 1,652 | 57.80 |
| Asian | 40,222 | 3.24 | 42,209 | 3.29 | 1,987 | 4.94 |
| Native Hawaiian/Pacific Islander | 915 | 0.07 | 753 | 0.06 | -162 | -17.70 |
| Some other race | 124,864 | 10.06 | 98,712 | 7.71 | -26,152 | -20.94 |
| Two or more races | 24,655 | 1.99 | 31,294 | 2.44 | 6,639 | 26.93 |
| Hispanic (of any race) | 514,026 | 41.42 | 530,798 | 41.44 | 16,772 | 3.26 |
| Households by Type | | | | | | |
| Total households | 463,719 | 100.00 | 484,335 | 100.00 | 20,616 | 4.45 |
| Families | 264,389 | 57.01 | 280,970 | 58.01 | 16,581 | 6.27 |
| Nonfamily households | 199,330 | 42.99 | 203,365 | 41.99 | 4,035 | 2.02 |
| Average Household Size | 2.63 | | 2.61 | | -0.02 | -0.76 |
| Average Family Size | 3.56 | | 3.47 | | -0.09 | -2.53 |
| Relationship | | | | | | |
| Population in households | 1,221,839 | 98.45 | 1,261,966 | 98.51 | 40,127 | 3.28 |
| School Enrollment | | | | | | |
| Population 3 & over enrolled | 308,443 | 100.00 | 319,598 | 100.00 | 11,155 | 3.62 |
| Nursery school, preschool | 18,435 | 5.98 | 21,520 | 6.73 | 3,085 | 16.73 |
| Kindergarten | 19,432 | 6.30 | 23,470 | 7.34 | 4,038 | 20.78 |
| Elementary school (grades 1-8) | 138,881 | 45.03 | 145,097 | 45.40 | 6,216 | 4.48 |
| High school (grades 9-12) | 59,636 | 19.33 | 62,387 | 19.52 | 2,751 | 4.61 |
| College or graduate school | 72,059 | 23.36 | 67,124 | 21.00 | -4,935 | -6.85 |
| Educational Attainment | | | | | | |
| Population 25 years & over | 797,098 | 100.00 | 814,744 | 100.00 | 17,646 | 2.21 |
| Less than 9th grade | 111,602 | 14.00 | 111,469 | 13.68 | -133 | -0.12 |
| 9th to 12th grade, no diploma | 93,445 | 11.72 | 96,931 | 11.90 | 3,486 | 3.73 |
| High school graduate (incl equiv) | 177,814 | 22.31 | 179,145 | 21.99 | 1,331 | 0.75 |
| Some college, no degree | 141,344 | 17.73 | 147,021 | 18.05 | 5,677 | 4.02 |
| Associate's degree | 36,715 | 4.61 | 36,797 | 4.52 | 82 | 0.22 |
| Bachelor's degree | 148,355 | 18.61 | 151,277 | 18.57 | 2,922 | 1.97 |
| Graduate or professional degree | 87,823 | 11.02 | 92,104 | 11.30 | 4,281 | 4.87 |
| Percent high school graduate or higher | 74.30 | | 74.40 | | 0.10 | 0.13 |
| Percent bachelor's degree or higher | 29.60 | | 29.90 | | 0.30 | 1.01 |
| Residence 1 year ago | 1,222,427 | 100.00 | 1,260,677 | 100.00 | 38,250 | 3.13 |
| Same house | 983,993 | 80.50 | 1,020,391 | 80.94 | 36,398 | 3.70 |
| Different house in U.S. | 230,348 | 18.84 | 228,470 | 18.12 | -1,878 | -0.82 |
| Same county | 160,896 | 13.16 | 160,673 | 12.74 | -223 | -0.14 |
| Different county | 69,452 | 5.68 | 67,797 | 5.38 | -1,655 | -2.38 |
| Same state | 41,648 | 3.41 | 42,238 | 3.35 | 590 | 1.42 |
| Different state | 27,804 | 2.27 | 25,559 | 2.03 | -2,245 | -8.07 |
| Abroad | 8,086 | 0.66 | 11,816 | 0.94 | 3,730 | 46.13 |
| Language Spoken at Home | | | | | | |
| Population 5 years & over | 1,140,547 | 100.00 | 1,176,612 | 100.00 | 36,065 | 3.16 |
| English only | 652,259 | 57.19 | 657,547 | 55.88 | 5,288 | 0.81 |
| Language other than English | 488,288 | 42.81 | 519,065 | 44.12 | 30,777 | 6.30 |
| Speak English less than very well | 238,634 | 20.92 | 287,247 | 24.41 | 48,613 | 20.37 |
| Spanish | 429,464 | 37.65 | 455,484 | 38.71 | 26,020 | 6.06 |
| Speak English less than very well | 211,752 | 18.57 | 259,942 | 22.09 | 48,190 | 22.76 |
| Employment Status | | | | | | |
| Population 16 years & over | 952,604 | 100.00 | 975,419 | 100.00 | 22,815 | 2.40 |
| In labor force | 647,916 | 68.02 | 660,071 | 67.67 | 12,155 | 1.88 |
| Civilian labor force | 647,338 | 67.95 | 659,944 | 67.66 | 12,606 | 1.95 |
| Employed | 587,296 | 61.65 | 616,198 | 63.17 | 28,902 | 4.92 |
| Unemployed | 60,042 | 6.30 | 43,746 | 4.48 | -16,296 | -27.14 |
| Armed forces | 578 | 0.06 | 127 | 0.01 | -451 | -78.03 |
| Not in labor force | 304,688 | 31.98 | 315,348 | 32.33 | 10,660 | 3.50 |
| Civilian labor force | 647,338 | 67.95 | 659,944 | 67.66 | 12,606 | 1.95 |
| Percent unemployed | 9.30 | | 6.60 | | -2.70 | -29.03 |
| Employment by Industry | | | | | | |
| Civilian employed population 16 years & over | 587,296 | 100.00 | 616,198 | 100.00 | 28,902 | 4.92 |
| Agriculture, forestry, fishing & hunting, mining | 5,280 | 0.90 | 5,163 | 0.84 | -117 | -2.22 |
| Construction | 56,435 | 9.61 | 58,007 | 9.41 | 1,572 | 2.79 |
| Manufacturing | 45,554 | 7.76 | 47,096 | 7.64 | 1,542 | 3.38 |
| Wholesale trade | 17,545 | 2.99 | 21,258 | 3.45 | 3,713 | 21.16 |
| Retail trade | 64,742 | 11.02 | 66,765 | 10.83 | 2,023 | 3.12 |
| Transportation, warehousing, utilities | 29,447 | 5.01 | 31,207 | 5.06 | 1,760 | 5.98 |
| Information | 11,989 | 2.04 | 13,286 | 2.16 | 1,297 | 10.82 |
| Finance, insurance, real estate | 57,826 | 9.85 | 54,452 | 8.84 | -3,374 | -5.83 |
| Professional, scientific, management | 89,516 | 15.24 | 95,826 | 15.55 | 6,310 | 7.05 |
| Education & health care | 104,567 | 17.80 | 109,681 | 17.80 | 5,114 | 4.89 |
| Arts, entertainment, recreation | 66,164 | 11.27 | 68,628 | 11.14 | 2,464 | 3.72 |
| Other services | 29,030 | 4.94 | 33,480 | 5.43 | 4,450 | 15.33 |
| Public administration | 9,201 | 1.57 | 11,349 | 1.84 | 2,148 | 23.35 |
| Household Income | | | | | | |
| Total households | 463,719 | 100.00 | 484,335 | 100.00 | 20,616 | 4.45 |
| Less than $10,000 | 45,160 | 9.74 | 47,261 | 9.76 | 2,101 | 4.65 |
| $10,000 to $14,999 | 31,381 | 6.77 | 31,268 | 6.46 | -113 | -0.36 |
| $15,000 to $24,999 | 62,782 | 13.54 | 60,593 | 12.51 | -2,189 | -3.49 |
| $25,000 to $34,999 | 59,955 | 12.93 | 59,729 | 12.33 | -226 | -0.38 |
| $35,000 to $49,999 | 66,557 | 14.35 | 70,059 | 14.46 | 3,502 | 5.26 |
| $50,000 to $74,999 | 77,805 | 16.78 | 78,485 | 16.20 | 680 | 0.87 |
| $75,000 to $99,999 | 39,764 | 8.58 | 46,123 | 9.52 | 6,359 | 15.99 |
| $100,000 to $149,999 | 39,837 | 8.59 | 40,473 | 8.36 | 636 | 1.60 |
| $150,000 to $199,999 | 17,067 | 3.68 | 20,156 | 4.16 | 3,089 | 18.10 |
| $200,000 or more | 23,411 | 5.05 | 30,188 | 6.23 | 6,777 | 28.95 |
| Median household income | 41,354 | | 43,003 | | 1,649 | 3.99 |
| Mean household income | 66,568 | | 73,312 | | 6,744 | 10.13 |
| Percent Families & People in Poverty | | | | | | |
| All families | 20.90 | | 20.70 | | -0.20 | -0.96 |
| All people | 23.90 | | 24.50 | | 0.60 | 2.51 |
| Housing Occupancy | | | | | | |
| Total housing units | 525,228 | 100.00 | 540,447 | 100.00 | 15,219 | 2.90 |
| Occupied housing units | 463,719 | 88.29 | 484,335 | 89.62 | 20,616 | 4.45 |
| Vacant housing units | 61,509 | 11.71 | 56,112 | 10.38 | -5,397 | -8.77 |
| Homeowner vacancy rate | 1.50 | | 1.70 | | 0.20 | 13.33 |
| Rental vacancy rate | 10.50 | | 7.80 | | -2.70 | -25.71 |
| Units in Structure | | | | | | |
| Total housing units | 525,228 | 100.00 | 540,447 | 100.00 | 15,219 | 2.90 |
| 1-unit, detached | 232,960 | 44.35 | 238,546 | 44.14 | 5,586 | 2.40 |
| 1-unit, attached | 20,787 | 3.96 | 18,388 | 3.40 | -2,399 | -11.54 |
| 2 units | 7,335 | 1.40 | 9,030 | 1.67 | 1,695 | 23.11 |
| 3 or 4 units | 21,875 | 4.16 | 24,478 | 4.53 | 2,603 | 11.90 |
| 5 to 9 units | 62,284 | 11.86 | 59,551 | 11.02 | -2,733 | -4.39 |
| 10 to 19 units | 62,132 | 11.83 | 71,069 | 13.15 | 8,937 | 14.38 |
| 20 or more units | 112,040 | 21.33 | 113,462 | 20.99 | 1,422 | 1.27 |
| Mobile home, boat, RV etc. | 5,815 | 1.11 | 5,648 | 1.05 | -167 | -2.87 |
| Year Structure Built | | | | | | |
| Total housing units | 525,228 | 100.00 | 540,447 | 100.00 | 15,219 | 2.90 |
| 2010 or later | 4,987 | 0.95 | 11,890 | 2.20 | 6,903 | 138.42 |
| 2000 to 2009 | 70,960 | 13.51 | 64,142 | 11.87 | -6,818 | -9.61 |
| 1990 to 1999 | 50,496 | 9.61 | 52,080 | 9.64 | 1,584 | 3.14 |
| 1980 to 1989 | 90,759 | 17.28 | 97,377 | 18.02 | 6,618 | 7.29 |
| 1970 to 1979 | 105,346 | 20.06 | 101,083 | 18.70 | -4,263 | -4.05 |
| 1960 to 1969 | 72,779 | 13.86 | 72,964 | 13.50 | 185 | 0.25 |
| 1950 to 1959 | 67,797 | 12.91 | 75,553 | 13.98 | 7,756 | 11.44 |
| 1940 to 1949 | 32,640 | 6.21 | 31,398 | 5.81 | -1,242 | -3.81 |
| 1939 or earlier | 29,464 | 5.61 | 33,960 | 6.28 | 4,496 | 15.26 |
| Housing Tenure | | | | | | |
| Occupied housing units | 463,719 | 100.00 | 484,335 | 100.00 | 20,616 | 4.45 |
| Owner-occupied | 196,361 | 42.34 | 199,532 | 41.20 | 3,171 | 1.61 |
| Renter-occupied | 267,358 | 57.66 | 284,803 | 58.80 | 17,445 | 6.52 |
| Avg household size, owner-occupied | 2.85 | | 2.84 | | -0.01 | -0.35 |
| Avg household size, renter-occupied | 2.48 | | 2.44 | | -0.04 | -1.61 |
| Year Householder Moved Into Unit | | | | | | |
| Occupied housing units | 463,719 | 100.00 | 484,335 | 100.00 | 20,616 | 4.45 |
| 2010 or later | 198,626 | 42.83 | 269,768 | 55.70 | 71,142 | 35.82 |
| 2000 to 2009 | 161,044 | 34.73 | 114,858 | 23.71 | -46,186 | -28.68 |
| 1990 to 1999 | 51,284 | 11.06 | 47,061 | 9.72 | -4,223 | -8.23 |
| 1980 to 1989 | 21,397 | 4.61 | 20,241 | 4.18 | -1,156 | -5.40 |
| 1970 to 1979 | 18,676 | 4.03 | 18,531 | 3.83 | -145 | -0.78 |
| 1969 or earlier | 12,692 | 2.74 | 13,876 | 2.86 | 1,184 | 9.33 |
| Occupants per room | | | | | | |
| 1.00 or less | 428,816 | 92.47 | 447,516 | 92.40 | 18,700 | 4.36 |
| 1.01 to 1.50 | 23,344 | 5.03 | 25,927 | 5.35 | 2,583 | 11.06 |
| 1.51 or more | 11,559 | 2.49 | 10,892 | 2.25 | -667 | -5.77 |
| Housing Value (owner occupied units) | 196,361 | 100.00 | 199,532 | 100.00 | 3,171 | 1.61 |
| Less than $50,000 | 19,404 | 9.88 | 18,371 | 9.21 | -1,033 | -5.32 |
| $50,000 to $99,999 | 55,184 | 28.10 | 55,133 | 27.63 | -51 | -0.09 |
| $100,000 to $149,999 | 31,755 | 16.17 | 30,211 | 15.14 | -1,544 | -4.86 |
| $150,000 to $199,999 | 19,631 | 10.00 | 16,998 | 8.52 | -2,633 | -13.41 |
| $200,000 to $299,999 | 25,884 | 13.18 | 26,357 | 13.21 | 473 | 1.83 |
| $300,000 to $499,999 | 27,519 | 14.01 | 30,369 | 15.22 | 2,850 | 10.36 |
| $500,000 to $999,999 | 12,073 | 6.15 | 16,201 | 8.12 | 4,128 | 34.19 |
| $1,000,000 or more | 4,911 | 2.50 | 5,892 | 2.95 | 981 | 19.98 |
| Median | 133,200 | | 140,700 | | 7,500 | 5.63 |
| Selected Monthly Owner Costs (SMOC) | | | | | | |
| Housing units with a mortgage | 120,975 | 100.00 | 120,389 | 100.00 | -586 | -0.48 |
| Less than $300 | 134 | 0.11 | 150 | 1301.33 | 16 | 11.94 |
| $300 to $499 | 1,743 | 1.44 | 1,364 | 1.13 | -379 | -21.74 |
| $500 to $699 | 5,268 | 4.35 | 6,198 | 5.15 | 930 | 17.65 |
| $700 to $999 | 22,507 | 18.60 | 19,653 | 16.32 | -2,854 | -12.68 |
| $1,000 to $1,499 | 34,803 | 28.77 | 35,928 | 29.84 | 1,125 | 3.23 |
| $1,500 to $1,999 | 20,650 | 17.07 | 19,712 | 16.37 | -938 | -4.54 |
| $2,000 or more | 35,870 | 29.65 | 37,384 | 31.05 | 1,514 | 4.22 |
| Median | 1,435 | | 1,449 | | 14 | 0.98 |
| Gross Rent | | | | | | |
| Occupied units paying rent | 262,184 | 100.00 | 279,001 | 100.00 | 16,817 | 6.41 |
| Less than $200 | 2,590 | 0.99 | 3,486 | 1.25 | 896 | 34.59 |
| $200 to $299 | 4,666 | 1.78 | 5,309 | 1.90 | 643 | 13.78 |
| $300 to $499 | 13,037 | 4.97 | 9,195 | 3.30 | -3,842 | -29.47 |
| $500 to $749 | 89,913 | 34.29 | 80,714 | 28.93 | -9,199 | -10.23 |
| $750 to $999 | 76,004 | 28.99 | 82,266 | 29.49 | 6,262 | 8.24 |
| $1,000 to $1,499 | 55,682 | 21.24 | 69,611 | 24.95 | 13,929 | 25.02 |
| $1,500 or more | 20,292 | 7.74 | 28,420 | 10.19 | 8,128 | 40.06 |
| Median | 807 | | 861 | | 54 | 6.69 |
| | | | | | |
|