
| Decision-Making Information |
|
ProximityOne information resources & solutions (888) DMI-SOLN (888) 364-7656 Put data to work more effectively. Certificate in Data Analytics Power of Combining Maps with Data Support & Technical Assistance help using these resources Metro in Regional Context 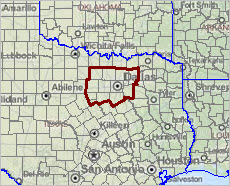 |
Situation & Outlook Report
Dallas-Fort Worth-Arlington, TX Metropolitan Statistical Area (CBSA 19100)
Geographic-Demographic-Economic Characteristics -- access other areas
See about updates.
This section is no longer being updated. Access the permanent replacement section at http://proximityone.com/cbsa/1/cbsa19100.htm. Please bookmark this new URL.
Access 2018 S&O Reports, featuring county and metro projections to 2030, via the interactive table at http://proximityone.com/metros.htm. The 2018 reports are similar but have been greatly expanded and updated.
Contents of this Report
This document is organized into these sections:
1. Recent Trends & Outlook
Summary of recent business, demographic, economic trends; year-ahead & 5-year outlook.
- the Recent Trends & Outlook section, updated quarterly, covers topics about this metro such as .. assessing the implications of next jobs report .. impact of Fed''s interest rate action .. which sectors are expanding or contracting .. housing market conditions .. insights to help your planning and decision-making. The Recent Trends & Outlook section is available in the subscription edition.
2. Overview & Update
The total population of the Dallas-Fort Worth-Arlington, TX MSA metro changed from 6,452,614 in 2010 to 6,958,092 in 2015, a change of 650,182 (10.1%). Among all 917 metros, this metro was ranked number 4 in 2010 and 4 in 2015, based on total population. Annual net migration was 61,870 (2011), 77,129 (2012), 57,668 (2013), 77,959 (2014), 77,959 (2015). View annual population estimates and components of change table. See more about population characteristics below.
This metro is projected to have a total population in 2020 of 7,418,541. The projected population change from 2010 to 2020 is 965,816 (15.0%). The population ages 65 years and over is projected to change from 592,695 (2010) to 1,031,937 (2020), a change of 439,242 (74.1%). See more about population projections.
Based on per capita personal income (PCPI), this metro was ranked number 61 in 2008 and 76 in 2014. among the 917 metros for which personal income was estimated.The PCPI changed from $44,697 in 2008 to $49,506 in 2014, a change of $4,809 (10.8%). Per capita personal income (PCPI) is a comprehensive measure of individual economic well-being. Use the interactive table to compare PCPI in this metro to other metros. See more about PCPI in Economic Characteristics section below.
282 metropolitan statistical areas, of the total 381, experienced an increase in real Gross Domestic Product (GDP) between 2009 and 2014. This metro ranked number 5 among the 381 metros based on 2014 GDP. The GDP (millions of current dollars) changed from $355,756 in 2009 to $504,358 in 2014 a change of $148,602 (41.77%). Real GDP (millions of real, inflation adjusted, dollars) changed from $355,756 in 2009 to $460,154 in 2014, a change of $104,398 (29.35%). GDP is the most comprehensive measure of metro economic activity. GDP is the sum of the GDP originating in all industries in the metro. See more about GDP in Economic Characteristics section below.
Attributes of driil-down, small area geography within the metro ... metros account for 65,744 of the national scope 73,056 census tracts (others are in non-metro areas). This metro is comprised of 1,324 tracts covering the metro wall-to-wall. View, rank, compare demographic-economic attributes of these tracts using the interactive tables. Use the CBSA code 19100; see table usage details below the table.
Fortune 1000 Companies with headquarters in this metro.
• AT&T
• Alliance Data Systems Corporation
• American Airlines Group Inc.
• Atmos Energy Corporation
• Brinker International, Inc.
• Celanese Corporation
• Cinemark Holdings, Inc.
• Comerica Incorporated
• Commercial Metals Company
• Crosstex Energy, Inc.
• D.R. Horton, Inc.
• Dean Foods Company
• Denbury Resources Inc.
• Dr Pepper Snapple Group, Inc.
• Energy Future Holdings Corp.
• Energy Transfer Equity, L.P.
• Exxon Mobil
• Flowserve Corporation
• Fluor Corporation
• Fossil Group, Inc.
• GameStop Corp.
• HollyFrontier Corporation
• J.C. Penney Company, Inc.
• Kimberly-Clark Corporation
• Lennox International Inc.
• Michaels Stores, Inc.
• Neiman Marcus Group LTD Inc.
• Pioneer Natural Resources Company
• Primoris Services Corporation
• RadioShack Corporation
• Regency Energy Partners LP
• Rent-A-Center, Inc.
• Sabre Corporation
• Sally Beauty Holdings, Inc.
• Southwest Airlines Co.
• Tenet Healthcare Corporation
• Texas Instruments Incorporated
• Torchmark Corporation
• Trinity Industries, Inc.
• Valhi, Inc.
Number in this metro: 40. Extended data & analysis in subscription edition.• Alliance Data Systems Corporation
• American Airlines Group Inc.
• Atmos Energy Corporation
• Brinker International, Inc.
• Celanese Corporation
• Cinemark Holdings, Inc.
• Comerica Incorporated
• Commercial Metals Company
• Crosstex Energy, Inc.
• D.R. Horton, Inc.
• Dean Foods Company
• Denbury Resources Inc.
• Dr Pepper Snapple Group, Inc.
• Energy Future Holdings Corp.
• Energy Transfer Equity, L.P.
• Exxon Mobil
• Flowserve Corporation
• Fluor Corporation
• Fossil Group, Inc.
• GameStop Corp.
• HollyFrontier Corporation
• J.C. Penney Company, Inc.
• Kimberly-Clark Corporation
• Lennox International Inc.
• Michaels Stores, Inc.
• Neiman Marcus Group LTD Inc.
• Pioneer Natural Resources Company
• Primoris Services Corporation
• RadioShack Corporation
• Regency Energy Partners LP
• Rent-A-Center, Inc.
• Sabre Corporation
• Sally Beauty Holdings, Inc.
• Southwest Airlines Co.
• Tenet Healthcare Corporation
• Texas Instruments Incorporated
• Torchmark Corporation
• Trinity Industries, Inc.
• Valhi, Inc.
3. Lay of the Land & Neighborhood Patterns of Economic Prosperity go top
3.1. Lay of the Land go top
Lay of the Land. The following map shows the metro with bold boundary.
Counties are labeled with county name and state-county FIPS code.
View developed with CV XE GIS software. See this section to learn about making custom metro maps.
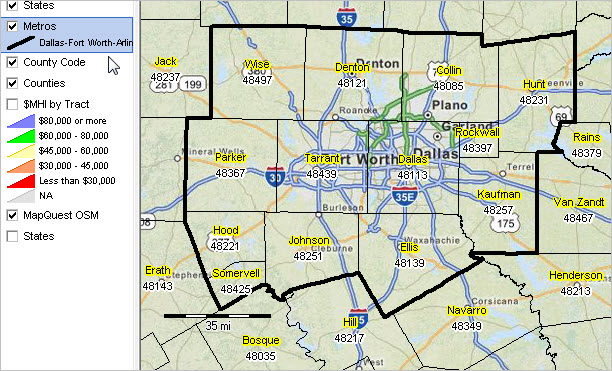
3.2. Patterns of Economic Prosperity by Neighborhood go top
Median household income by census tract (see color/data legend at left of map).

View developed with CV XE GIS software. See this section to learn about making custom metro maps.
4. Population Characteristics & Trends go top
Updated monthly, quarterly, annually. Housing market conditions and extended detail Available in subscription edition.
4.1. Component City Characteristics go top
Principal Cities (about principal cities); Click link to view city profile.
• Arlington
• Dallas
• Denton
• Fort Worth
• Irving
• Plano
• Richardson
Cities 10,000 population and over; click link to view city profile.
| Area | Census 2010 | July 1 2010 | July 1 2011 | July 1 2012 | July 1 2013 | July 1 2014 | Change 2010-14 | %Change 2010-14 |
| Addison, TX (4801240) | 13,056 | 13,084 | 13,793 | 15,186 | 15,423 | 15,457 | 2,373 | 18.10 |
| Allen, TX (4801924) | 84,246 | 84,944 | 87,798 | 89,997 | 92,339 | 94,179 | 9,235 | 10.90 |
| Arlington, TX (4804000) | 365,438 | 366,251 | 370,908 | 376,394 | 379,843 | 383,204 | 16,953 | 4.60 |
| Azle, TX (4805168) | 10,947 | 10,974 | 11,108 | 11,237 | 11,326 | 11,530 | 556 | 5.10 |
| Balch Springs, TX (4805372) | 23,728 | 23,934 | 24,402 | 24,878 | 25,078 | 25,120 | 1,186 | 5.00 |
| Bedford, TX (4807132) | 46,979 | 47,076 | 47,716 | 48,254 | 48,595 | 48,908 | 1,832 | 3.90 |
| Benbrook, TX (4807552) | 21,234 | 21,298 | 21,619 | 21,969 | 22,213 | 22,419 | 1,121 | 5.30 |
| Burleson, TX (4811428) | 36,690 | 36,893 | 38,316 | 39,011 | 40,647 | 41,818 | 4,925 | 13.30 |
| Carrollton, TX (4813024) | 119,097 | 119,479 | 122,505 | 125,485 | 126,637 | 128,353 | 8,874 | 7.40 |
| Cedar Hill, TX (4813492) | 45,028 | 45,123 | 45,853 | 46,477 | 46,728 | 48,084 | 2,961 | 6.60 |
| Cleburne, TX (4815364) | 29,337 | 29,786 | 29,639 | 29,795 | 29,674 | 29,848 | 62 | 0.20 |
| Colleyville, TX (4815988) | 22,807 | 22,907 | 23,344 | 23,960 | 24,506 | 24,952 | 2,045 | 8.90 |
| Coppell, TX (4816612) | 38,659 | 38,768 | 39,464 | 40,079 | 40,392 | 40,678 | 1,910 | 4.90 |
| Corinth, TX (4816696) | 19,935 | 19,867 | 20,235 | 20,493 | 20,648 | 20,836 | 969 | 4.90 |
| Crowley, TX (4817960) | 12,838 | 12,930 | 13,338 | 13,605 | 14,138 | 14,572 | 1,642 | 12.70 |
| Dallas, TX (4819000) | 1,197,816 | 1,200,648 | 1,219,399 | 1,243,243 | 1,260,725 | 1,281,047 | 80,399 | 6.70 |
| DeSoto, TX (4820092) | 49,047 | 49,324 | 50,167 | 51,173 | 51,547 | 51,934 | 2,610 | 5.30 |
| Denton, TX (4819972) | 113,383 | 116,922 | 120,045 | 123,527 | 125,117 | 128,205 | 11,283 | 9.70 |
| Duncanville, TX (4821628) | 38,524 | 38,606 | 39,037 | 39,561 | 39,661 | 39,707 | 1,101 | 2.90 |
| Ennis, TX (4824348) | 18,513 | 18,578 | 18,667 | 18,652 | 18,713 | 18,823 | 245 | 1.30 |
| Euless, TX (4824768) | 51,277 | 51,457 | 52,152 | 52,833 | 53,252 | 53,630 | 2,173 | 4.20 |
| Farmers Branch, TX (4825452) | 28,616 | 28,661 | 28,978 | 29,407 | 31,724 | 32,560 | 3,899 | 13.60 |
| Flower Mound, TX (4826232) | 64,669 | 64,895 | 66,067 | 67,893 | 68,536 | 69,650 | 4,755 | 7.30 |
| Forest Hill, TX (4826544) | 12,355 | 12,380 | 12,505 | 12,637 | 12,723 | 12,795 | 415 | 3.40 |
| Forney, TX (4826604) | 14,661 | 14,741 | 15,349 | 15,890 | 16,607 | 17,536 | 2,795 | 19.00 |
| Fort Worth, TX (4827000) | 741,206 | 745,879 | 761,895 | 778,728 | 794,055 | 812,238 | 66,359 | 8.90 |
| Frisco, TX (4827684) | 116,989 | 118,129 | 123,605 | 128,624 | 137,062 | 145,035 | 26,906 | 22.80 |
| Garland, TX (4829000) | 226,876 | 227,329 | 230,205 | 233,831 | 234,845 | 235,501 | 8,172 | 3.60 |
| Glenn Heights, TX (4829840) | 11,278 | 11,351 | 11,535 | 11,719 | 11,819 | 11,915 | 564 | 5.00 |
| Grand Prairie, TX (4830464) | 175,396 | 175,978 | 178,811 | 181,866 | 183,766 | 185,453 | 9,475 | 5.40 |
| Grapevine, TX (4830644) | 46,334 | 46,617 | 47,148 | 48,520 | 50,231 | 50,844 | 4,227 | 9.10 |
| Greenville, TX (4830920) | 25,557 | 25,654 | 25,797 | 25,920 | 25,897 | 26,180 | 526 | 2.10 |
| Haltom City, TX (4831928) | 42,409 | 42,492 | 42,923 | 43,406 | 43,675 | 43,913 | 1,421 | 3.30 |
| Highland, TX (4833848) | 15,056 | 15,148 | 15,406 | 15,626 | 15,756 | 15,995 | 847 | 5.60 |
| Hurst, TX (4835576) | 37,337 | 37,417 | 37,807 | 38,208 | 38,505 | 38,733 | 1,316 | 3.50 |
| Irving, TX (4837000) | 216,290 | 216,866 | 220,012 | 225,748 | 229,087 | 232,406 | 15,540 | 7.20 |
| Keller, TX (4838632) | 39,627 | 39,840 | 40,884 | 41,968 | 42,923 | 43,924 | 4,084 | 10.30 |
| Lancaster, TX (4841212) | 36,361 | 36,777 | 37,343 | 37,909 | 38,161 | 38,453 | 1,676 | 4.60 |
| Lewisville, TX (4842508) | 95,290 | 95,803 | 97,424 | 99,555 | 101,143 | 102,889 | 7,086 | 7.40 |
| Little Elm, TX (4843012) | 25,898 | 26,199 | 27,654 | 28,940 | 32,847 | 35,414 | 9,215 | 35.20 |
| Mansfield, TX (4846452) | 56,368 | 56,811 | 58,065 | 59,398 | 60,922 | 62,246 | 5,435 | 9.60 |
| McKinney, TX (4845744) | 131,117 | 132,806 | 137,960 | 143,470 | 149,168 | 156,767 | 23,961 | 18.00 |
| Mesquite, TX (4847892) | 139,824 | 139,902 | 141,454 | 143,421 | 143,733 | 144,416 | 4,514 | 3.20 |
| Midlothian, TX (4848096) | 18,037 | 18,446 | 18,970 | 19,367 | 20,172 | 20,934 | 2,488 | 13.50 |
| Murphy, TX (4850100) | 17,708 | 18,007 | 18,724 | 19,181 | 19,587 | 20,230 | 2,223 | 12.30 |
| North Richland Hills, TX (4852356) | 63,343 | 63,498 | 64,387 | 65,357 | 67,363 | 68,529 | 5,031 | 7.90 |
| Plano, TX (4858016) | 259,841 | 261,249 | 267,620 | 272,950 | 275,414 | 278,480 | 17,231 | 6.60 |
| Red Oak, TX (4861196) | 10,769 | 10,827 | 10,978 | 11,074 | 11,251 | 11,560 | 733 | 6.80 |
| Richardson, TX (4861796) | 99,223 | 99,565 | 101,676 | 103,715 | 105,251 | 108,617 | 9,052 | 9.10 |
| Rockwall, TX (4862828) | 37,490 | 37,996 | 39,070 | 39,943 | 40,953 | 41,785 | 3,789 | 10.00 |
| Rowlett, TX (4863572) | 56,199 | 56,350 | 57,019 | 57,745 | 58,092 | 58,407 | 2,057 | 3.70 |
| Sachse, TX (4864064) | 20,329 | 20,472 | 21,087 | 21,623 | 22,064 | 23,681 | 3,209 | 15.70 |
| Saginaw, TX (4864112) | 19,806 | 19,915 | 20,385 | 20,876 | 21,274 | 21,703 | 1,788 | 9.00 |
| Seagoville, TX (4866428) | 14,835 | 14,972 | 15,248 | 15,478 | 15,595 | 15,723 | 751 | 5.00 |
| Southlake, TX (4869032) | 26,575 | 26,668 | 27,140 | 27,718 | 28,249 | 29,086 | 2,418 | 9.10 |
| Terrell, TX (4872284) | 15,816 | 15,878 | 15,978 | 16,103 | 16,242 | 16,561 | 683 | 4.30 |
| The Colony, TX (4872530) | 36,328 | 36,545 | 37,101 | 39,048 | 39,416 | 41,352 | 4,807 | 13.20 |
| University Park, TX (4874492) | 23,068 | 23,108 | 23,421 | 23,829 | 24,060 | 24,396 | 1,288 | 5.60 |
| Watauga, TX (4876672) | 23,497 | 23,553 | 23,792 | 24,044 | 24,195 | 24,345 | 792 | 3.40 |
| Waxahachie, TX (4876816) | 29,621 | 29,806 | 30,354 | 31,055 | 31,671 | 32,344 | 2,538 | 8.50 |
| Weatherford, TX (4876864) | 25,250 | 25,458 | 25,838 | 26,442 | 27,008 | 27,769 | 2,311 | 9.10 |
| White Settlement, TX (4878544) | 16,116 | 16,161 | 16,409 | 16,588 | 16,749 | 16,896 | 735 | 4.50 |
| Wylie, TX (4880356) | 41,427 | 41,738 | 43,273 | 44,378 | 44,943 | 45,913 | 4,175 | 10.00 |
All places time series population estimates interactive table.
4.2. Component County Characteristics go top
Updated periodically, annually. General demographics, social characteristics and extended detail Available in subscription edition.
Metropolitan areas are defined as one or more contiguous counties based on a set of demographic-economic criteria. Counties comprising the metro are shown below. For multi-county metros, this section provides insights into how the population is changing by county. Many metros changed geographic composition (counties included in the metro) between the Census 2010 vintage and the current vintage. These changes, if any, are also shown below (county is marked with **). See projections in related section.Click county code link to view county components of change.
** indicates this county added since Census 2010 vintage metro definition.
All counties interactive tables General Demographics | Social | Economic | HousingMetropolitan areas are defined as one or more contiguous counties based on a set of demographic-economic criteria. Counties comprising the metro are shown below. For multi-county metros, this section provides insights into how the population is changing by county. Many metros changed geographic composition (counties included in the metro) between the Census 2010 vintage and the current vintage. These changes, if any, are also shown below (county is marked with **). See projections in related section.Click county code link to view county components of change.
| Area | July 1 2010 | Pct | July 1 2011 | Pct | July 1 2012 | Pct | July 1 2013 | Pct | July 1 2014 | Pct | July 1 2015 | Pct |
| Metro Summary ... more details | 6,452,614 | 100.0 | 6,574,298 | 100.0 | 6,709,559 | 100.0 | 6,822,353 | 100.0 | 6,958,092 | 100.0 | 7,102,796 | 100.0 |
| Collin County, TX (48085) | 788,629 | 12.2 | 814,698 | 12.4 | 837,480 | 12.5 | 858,717 | 12.6 | 886,052 | 12.7 | 914,127 | 12.9 |
| Dallas County, TX (48113) | 2,373,464 | 36.8 | 2,409,778 | 36.7 | 2,456,444 | 36.6 | 2,485,781 | 36.4 | 2,519,625 | 36.2 | 2,553,385 | 35.9 |
| Delta County, TX (48119) | 14,075 | 0.2 | 14,210 | 0.2 | 14,250 | 0.2 | 14,373 | 0.2 | 14,333 | 0.2 | 14,374 | 0.2 |
| Denton County, TX (48121) | 666,962 | 10.3 | 685,861 | 10.4 | 708,300 | 10.6 | 729,690 | 10.7 | 754,792 | 10.8 | 780,612 | 11.0 |
| Ellis County, TX (48139) | 150,376 | 2.3 | 152,406 | 2.3 | 153,779 | 2.3 | 156,110 | 2.3 | 159,365 | 2.3 | 163,632 | 2.3 |
| Hunt County, TX (48231) | 86,337 | 1.3 | 86,768 | 1.3 | 87,266 | 1.3 | 87,562 | 1.3 | 88,822 | 1.3 | 89,844 | 1.3 |
| Hood County, TX (48221) ** | 51,282 | 0.8 | 51,489 | 0.8 | 52,149 | 0.8 | 52,889 | 0.8 | 53,904 | 0.8 | 55,423 | 0.8 |
| Johnson County, TX (48251) | 151,259 | 2.3 | 151,955 | 2.3 | 153,394 | 2.3 | 154,699 | 2.3 | 157,213 | 2.3 | 159,990 | 2.3 |
| Kaufman County, TX (48257) | 103,882 | 1.6 | 105,293 | 1.6 | 106,675 | 1.6 | 108,490 | 1.6 | 111,295 | 1.6 | 114,690 | 1.6 |
| Parker County, TX (48367) | 117,328 | 1.8 | 118,526 | 1.8 | 119,790 | 1.8 | 120,169 | 1.8 | 122,565 | 1.8 | 126,042 | 1.8 |
| Rockwall County, TX (48397) | 78,960 | 1.2 | 81,100 | 1.2 | 82,928 | 1.2 | 85,154 | 1.2 | 87,635 | 1.3 | 90,861 | 1.3 |
| Tarrant County, TX (48439) | 1,816,528 | 28.2 | 1,848,011 | 28.1 | 1,882,338 | 28.1 | 1,913,437 | 28.0 | 1,946,346 | 28.0 | 1,982,498 | 27.9 |
| Wise County, TX (48497) | 59,108 | 0.9 | 59,969 | 0.9 | 60,430 | 0.9 | 61,048 | 0.9 | 61,813 | 0.9 | 62,953 | 0.9 |
All counties population estimates & components of change time series interactive table.
4.2.1. RDEMS County Characteristics
Updated quarterly. For more information, see RDEMS Main.
Links open HSG1 Housing & New Residential Construction section. Select other sections from list above table.
Collin County, TX
Dallas County, TX
Denton County, TX
Ellis County, TX
Hood County, TX
Hunt County, TX
Johnson County, TX
Kaufman County, TX
Parker County, TX
Rockwall County, TX
Tarrant County, TX
Wise County, TX
Dallas County, TX
Denton County, TX
Ellis County, TX
Hood County, TX
Hunt County, TX
Johnson County, TX
Kaufman County, TX
Parker County, TX
Rockwall County, TX
Tarrant County, TX
Wise County, TX
4.3. General Demographic Characteristics
Updated annually. For more information, detail & to compare areas use interactive table.
| Item | 2013 | 2014 | Change 2013-14 | %Change 2013-14 |
| Total Population: Race/Origin | 6,812,373 | 6,954,003 | 141,630 | 2.08 |
| One race | 6,614,475 | 6,749,833 | 135,358 | 2.05 |
| White | 4,715,476 | 4,890,399 | 174,923 | 3.71 |
| Black/African American | 4,715,476 | 4,890,399 | 174,923 | 3.71 |
| American Indian/Alaska Native | 29,012 | 30,480 | 1,468 | 5.06 |
| Asian alone | 389,458 | 413,319 | 23,861 | 6.13 |
| Native Hawaiian/Pacific Islander | 5,306 | 6,868 | 1,562 | 29.44 |
| Some other race alone | 447,188 | 351,891 | -95,297 | -21.31 |
| Two or more races | 197,898 | 204,170 | 6,272 | 3.17 |
| Hispanic or Latino (of any race) | 1,908,843 | 1,962,628 | 53,785 | 2.82 |
| Population 25 years and over | 4,332,404 | 4,446,362 | 113,958 | 2.82 |
| % high school graduate or higher | 84.4 | 84.3 | -0.1 | -0.12 |
| % bachelor's degree or higher | 32.6 | 32.4 | -0.2 | -0.61 |
| Total Households | 2,406,092 | 2,445,239 | 39,147 | -0.61 |
| Median household income ($) | 57,398 | 59,530 | 2,132 | 3.71 |
| Mean household income ($) | 81,531 | 83,408 | 1,877 | 2.30 |
| Item | 2013 | 2014 | Change 2013-14 | %Change 2013-14 |
| Total Population: Gender & Age | 6,812,373 | 6,954,003 | 141,630 | 2.08 |
| Male | 3,358,643 | 3,418,202 | 59,559 | 2.30 |
| Female | 3,453,730 | 3,535,801 | 82,071 | 2.30 |
| Under 5 years | 494,786 | 497,902 | 3,116 | 2.30 |
| 5 to 9 years | 531,230 | 527,599 | -3,631 | -0.68 |
| 10 to 14 years | 517,311 | 531,489 | 14,178 | 2.74 |
| 15 to 19 years | 473,800 | 482,146 | 8,346 | 1.76 |
| 20 to 24 years | 462,842 | 468,505 | 5,663 | 1.22 |
| 25 to 34 years | 997,956 | 1,021,497 | 23,541 | 2.36 |
| 35 to 44 years | 991,105 | 1,000,366 | 9,261 | 0.93 |
| 45 to 54 years | 944,526 | 960,957 | 16,431 | 1.74 |
| 55 to 59 years | 408,399 | 419,324 | 10,925 | 2.68 |
| 55 to 59 years | 408,399 | 419,324 | 10,925 | 2.68 |
| 60 to 64 years | 313,959 | 332,127 | 18,168 | 5.79 |
| 65 to 74 years | 409,679 | 436,343 | 26,664 | 6.51 |
| 75 to 84 years | 193,385 | 202,151 | 8,766 | 4.53 |
| 85 years and over | 73,395 | 73,597 | 202 | 0.28 |
| Median age | 34.2 | 34.5 | 0.3 | 0.88 |
| 18 years and over | 4,972,136 | 5,093,898 | 121,762 | 2.45 |
| 21 years and over | 4,701,408 | 4,825,548 | 124,140 | 2.64 |
| 62 years and over | 851,135 | 900,494 | 49,359 | 5.80 |
| 65 years and over | 676,459 | 712,091 | 35,632 | 5.27 |
5. Housing Characteristics & Trends go top
Updated monthly, quarterly, annually. Housing market conditions and extended detail Available in subscription edition.
5.1. Total Housing Units
Updated Annually. Independent annual model-based estimates. For more information, detail & to compare areas use interactive table.
| Item | Census 2010 | July 1 2010 | July 1 2011 | July 1 2012 | July 1 2013 | July 1 2014 | Change 2010-2014 | %Change 2010-2014 |
| Total Housing Units | 2,528,242 | 2,532,738 | 2,549,870 | 2,573,228 | 2,607,765 | 2,645,540 | 112,802 | 4.45 |
5.2. General Housing Characteristics
Updated Annually. For more information, detail & to compare areas use interactive table.
| Item | 2013 | 2014 | Change 2013-14 | %Change 2013-14 |
| Housing Units: Units in Structure | 2,602,737 | 2,645,453 | 42,716 | 1.64 |
| 1-unit, detached | 1,646,839 | 1,677,226 | 30,387 | 1.85 |
| 1-unit, attached | 74,447 | 76,655 | 2,208 | 2.97 |
| 2 units | 31,507 | 33,263 | 1,756 | 5.57 |
| 3 or 4 units | 91,748 | 92,534 | 786 | 0.86 |
| 5 to 9 units | 176,645 | 181,316 | 4,671 | 2.64 |
| 10 to 20 units | 205,649 | 215,586 | 9,937 | 4.83 |
| 20 or more units | 269,214 | 265,263 | -3,951 | -1.47 |
| Item | 2013 | 2014 | Change 2013-14 | %Change 2013-14 |
| Housing Units: Occupancy & Tenure | 2,602,737 | 2,645,453 | 42,716 | 1.64 |
| Occupied Housing Units | 2,406,092 | 2,445,239 | 39,147 | 1.63 |
| Owner | 1,431,527 | 1,447,277 | 15,750 | 1.10 |
| Renter | 974,565 | 997,962 | 23,397 | 2.40 |
| Vacant Housing Units | 196,645 | 200,214 | 3,569 | 1.81 |
| Homeowner vacancy rate | 1.40 | 1.30 | -0.10 | ... |
| Rental vacancy rate | 7.20 | 7.00 | -0.20 | ... |
| Average household size; owner-occ | 2.95 | 2.97 | 0.02 | 0.68 |
| Average household size; renter-occ | 2.57 | 2.58 | 0.01 | 0.39 |
| Median Value $ owner occupied | 152,700 | 160,600 | 7,900 | 5.17 |
| Median Rent $ renter occupied | 908 | 949 | 41 | 4.52 |
5.3. Residential Construction; Housing Units Authorized & Value
Updated Monthly. 12 most recent months. For more information, detail & to compare areas use interactive table.
| Item | Aug15 | Sep15 | Oct15 | Nov15 | Dec15 | Jan16 | Feb16 | Mar16 | Apr16 | May16 | Jun16 | Jul16 |
| Total Residential Units | 5,539 | 4,683 | 4,979 | 3,712 | 4,354 | 3,504 | 3,628 | 4,028 | 4,028 | 4,692 | 4,932 | 5,568 |
| in 1 unit bldgs | 2,350 | 2,433 | 2,321 | 1,833 | 1,925 | 1,876 | 2,271 | 2,491 | 2,670 | 2,707 | 3,091 | 2,666 |
| in 2 unit bldgs | 20 | 22 | 24 | 6 | 16 | 50 | 10 | 10 | 14 | 24 | 30 | 24 |
| in 3-4 unit bldgs | 55 | 7 | 7 | 7 | 6 | 8 | 4 | 10 | 16 | 22 | 4 | 8 |
| in 5+ unit bldgs | 3,114 | 2,221 | 2,627 | 1,866 | 2,407 | 1,570 | 1,343 | 1,517 | 1,328 | 1,939 | 1,807 | 2,870 |
| Bldgs with 5+ units | 44 | 51 | 95 | 30 | 26 | 21 | 46 | 16 | 16 | 40 | 50 | 29 |
| Percent Coverage | 99 | 99 | 99 | 99 | 99 | 99 | 99 | 99 | 100 | 100 | 100 | 100 |
| Value ($000), Total Units | 925,616 | 808,522 | 890,520 | 699,323 | 751,413 | 704,212 | 786,114 | 831,588 | 884,192 | 1,016,487 | 1,045,288 | 1,047,844 |
| 1 unit structures | 651,207 | 632,049 | 652,435 | 523,250 | 529,510 | 520,382 | 661,327 | 674,778 | 760,459 | 771,221 | 869,380 | 722,387 |
| 2 unit structures | 2,367 | 3,046 | 3,679 | 712 | 2,301 | 7,276 | 1,325 | 1,590 | 2,273 | 3,586 | 3,082 | 2,449 |
| 3-4 unit structures | 6,653 | 854 | 1,355 | 863 | 739 | 977 | 493 | 1,339 | 1,707 | 2,292 | 503 | 1,161 |
| 5+ unit structures | 265,389 | 172,573 | 233,051 | 174,498 | 218,863 | 175,577 | 122,969 | 153,881 | 119,753 | 239,388 | 172,323 | 321,847 |
5.4. Housing Price Index go top
Updated quarterly. All transactions; not seasonally adjusted. See related Housing Price Index (HPI) interactive table.
See related 5-Digit ZIP Code HPI interactive table.
| Housing Price Index: | 2015Q3 | 2015Q4 | 2016Q1 | 2016Q2 | 2016Q3 |
| 208.88 | 211.96 | 216.99 | 224.63 | 228.61 | |
| Quarter-to-Quarter/Year Percent Change: | 2015Q3-2015Q4 | 2015Q4-2016Q1 | 2016Q1-2016Q2 | 2016Q2-2016Q3 | 2015Q3-2016Q3 |
| 1.47 | 2.37 | 3.52 | 1.77 | 9.45 |
6.1. Economic Profile go top
The Economic Profile shows shows derivation and key components of total personal income. Data are organized by place of residence and place of work. The place of residence profile includes estimates of total personal income, population, and per capita personal income. The place of work profile includes estimates of total earnings, total employment and average earnings per job. Updated annually. See related interactive table.
Dollar items are in current dollars (not adjusted for inflation). Per capita items in dollars; other dollar items in thousands of dollars.
See related notes.
| Item | 2011 | 2012 | 2013 | 2014 | 2015 | Change 2011-2015 | %Change 2011-2015 |
| Personal income | 291,754,061 | 310,526,401 | 318,023,388 | 343,465,712 | 362,947,715 | 71,193,654 | 24.4 |
| Net earnings 1/ | 205,432,336 | 220,363,066 | 228,917,847 | 246,242,338 | 261,690,920 | 56,258,584 | 27.4 |
| Personal current transfer receipts | 36,061,871 | 36,226,018 | 37,605,478 | 39,669,754 | 42,256,809 | 6,194,938 | 17.2 |
| Income maintenance 2/ | 4,583,676 | 4,712,256 | 4,809,008 | 4,746,649 | 4,743,407 | 159,731 | 3.5 |
| Unemployment insurance compensation | 1,458,908 | 1,236,048 | 950,836 | 615,685 | 710,154 | -748,754 | -51.3 |
| Retirement and other | 30,019,287 | 30,277,714 | 31,845,634 | 34,307,420 | 36,803,248 | 6,783,961 | 22.6 |
| Dividends, interest, and rent 3/ | 50,259,854 | 53,937,317 | 51,500,063 | 57,553,620 | 58,999,986 | 8,740,132 | 17.4 |
| Population 4/ | 6,574,298 | 6,709,559 | 6,822,353 | 6,958,092 | 7,102,796 | 528,498 | 8.0 |
| Per capita personal income | 44,378 | 46,281 | 46,615 | 49,362 | 51,099 | 6,721 | 15.1 |
| Per capita net earnings | 31,248 | 32,843 | 33,554 | 35,389 | 36,843 | 5,595 | 17.9 |
| Per capita personal current transfer receipts | 5,485 | 5,399 | 5,512 | 5,701 | 5,949 | 464 | 8.5 |
| Per capita income maintenance | 697 | 702 | 705 | 682 | 668 | -29 | -4.2 |
| Per capita unemployment insurance compensation | 222 | 184 | 139 | 88 | 100 | -122 | -55.0 |
| Per capita retirement and other | 4,566 | 4,513 | 4,668 | 4,931 | 5,182 | 616 | 13.5 |
| Per capita dividends, interest, and rent | 7,645 | 8,039 | 7,549 | 8,271 | 8,307 | 662 | 8.7 |
| Earnings by place of work | 227,464,791 | 243,661,737 | 256,201,816 | 275,258,059 | 292,805,527 | 65,340,736 | 28.7 |
| Wages and salaries | 161,156,618 | 171,513,401 | 178,078,200 | 190,141,435 | 202,775,570 | 41,618,952 | 25.8 |
| Supplements to wages and salaries | 31,541,420 | 33,308,333 | 34,990,543 | 36,802,989 | 39,342,291 | 7,800,871 | 24.7 |
| Employer cont. for empl. pension & insur. funds 6/ | 20,333,226 | 21,452,936 | 22,660,155 | 23,775,009 | 25,515,964 | 5,182,738 | 25.5 |
| Employer cont. for government social insurance | 11,208,194 | 11,855,397 | 12,330,388 | 13,027,980 | 13,826,327 | 2,618,133 | 23.4 |
| Proprietors' income | 34,766,753 | 38,840,003 | 43,133,073 | 48,313,635 | 50,687,666 | 15,920,913 | 45.8 |
| Nonfarm proprietors' income | -73,886 | -1,325 | 54,943 | -1,441 | 39,325 | 113,211 | ... |
| Farm proprietors' income | 34,840,639 | 38,841,328 | 43,078,130 | 48,315,076 | 50,648,341 | 15,807,702 | 45.4 |
| Total full-time and part-time employment | 4,105,155 | 4,226,381 | 4,354,523 | 4,494,682 | 4,647,142 | 541,987 | 13.2 |
| Wage and salary jobs | 3,076,442 | 3,169,924 | 3,258,210 | 3,367,408 | 3,490,533 | 414,091 | 13.5 |
| Number of proprietors | 1,028,713 | 1,056,457 | 1,096,313 | 1,127,274 | 1,156,609 | 127,896 | 12.4 |
| Number of nonfarm proprietors 7/ | 26,325 | 26,713 | 26,806 | 26,265 | 25,873 | -452 | -1.7 |
| Number of farm proprietors | 1,002,388 | 1,029,744 | 1,069,507 | 1,101,009 | 1,130,736 | 128,348 | 12.8 |
| Average earnings per job (dollars) | 55,410 | 57,653 | 58,836 | 61,241 | 63,008 | 7,598 | 13.7 |
| Average wages and salaries | 52,384 | 54,106 | 54,655 | 56,465 | 58,093 | 5,709 | 10.9 |
| Average nonfarm proprietors' income | 34,758 | 37,719 | 40,278 | 43,883 | 44,792 | 10,034 | 28.9 |
See related notes.
6.2. Cost of Living Indexes go top
Updated periodically. Available in subscription edition.
6.3. Cost of Doing Business Indexes go top
Updated periodically. Available in subscription edition.
6.4. Consumer Price Index go top
Updated monthly. Available in subscription edition.
6.5. Gross Domestic Product by Sector go top
Updated quarterly, annually. For more information, detail & to compare areas use interactive table. Additional detail in subscription edition.
| Item | 2009 | 2010 | 2011 | 2012 | 2013 | 2014 | Change 2009-14 | %Change 2009-14 |
| Gross Domestic Product, millions of current dollars | 355,756 | 375,940 | 402,824 | 430,109 | 461,320 | 504,358 | 148,602 | 41.77 |
| Real Gross Domestic Product, millions of real dollars | 355,756 | 366,833 | 382,202 | 402,744 | 424,000 | 460,154 | 104,398 | 29.35 |
6.6. Establishments, Employment & Earnings by Detailed Type of Business go top
Updated quarterly. For more information, detail & to compare areas use interactive table.
| Sector | Establishments 2015Q1 | Employment 2015Q1 | Avg Weekly Wages 2015Q1 | Establishments 2015Q2 | Employment 2015Q2 | Avg Weekly Wages 2015Q2 |
| Total, all industries | 163,602 | 5,336,414 | 1,161 | 164,656 | 5,434,702 | 1,057 |
| Total, all industries - Fed Govt | 484 | 72,884 | 1,655 | 483 | 72,985 | 1,449 |
| Total, all industries - St Govt | 267 | 79,132 | 1,151 | 265 | ... | ... |
| Total, all industries - Local Govt | 1,263 | 513,812 | 875 | 1,263 | ... | ... |
| Total, all industries - Private | 161,588 | 4,670,586 | 1,185 | 162,645 | 4,760,824 | 1,067 |
| Goods-producing | 19,519 | 766,698 | 1,480 | 19,616 | 769,354 | 1,310 |
| Natural resources and mining | 1,943 | 58,639 | 2,674 | 1,931 | 53,633 | 2,314 |
| Construction | 11,232 | 270,481 | 1,048 | 11,318 | 278,540 | 1,069 |
| Manufacturing | 6,344 | 437,578 | 1,591 | 6,367 | 437,181 | 1,341 |
| Service-providing | 142,069 | 3,903,888 | 1,127 | 143,029 | 3,991,470 | 1,020 |
| Trade, transportation & utilities | 35,670 | 1,134,052 | 1,002 | 35,765 | 1,147,892 | 961 |
| Information | 2,531 | 129,553 | 2,183 | 2,552 | 129,913 | 1,725 |
| Financial activities | 18,481 | 432,880 | 1,931 | 18,875 | 437,094 | 1,482 |
| Professional & business services | 34,458 | 870,022 | 1,375 | 34,631 | 885,061 | 1,286 |
| Education and health services | 21,500 | 644,568 | 965 | 21,678 | 658,641 | 932 |
| Leisure and hospitality | 14,527 | 547,796 | 421 | 14,677 | 583,530 | 418 |
| Other services | 14,206 | 142,925 | 694 | 14,184 | 147,289 | 685 |
| Unclassified | 696 | 2,092 | 797 | 667 | 2,051 | 742 |
Notes: cell value of '...' indicates value suppressed to maintain confidentiality.
Use the following links to access detailed establishment and employment data by type of business (CSV files).
.. see notes on using these files.
2013Q1 .. 2013Q2 .. 2013Q3 .. 2013Q4 .|. 2014Q1 .. 2014Q2 .. 2014Q3 .. 2014Q4 .|. 2015Q1 .. 2015Q2 .. 2015Q3 .. 2015Q4 .. 2016Q1 .. 2016Q2
6.7. Labor Market Characteristics & Trends go top
Updated monthly. Available in subscription edition.
For more information, detail & to compare areas use interactive table.
Table shows 13 most recent months.
| Item | Aug15 | Sep15 | Oct15 | Nov15 | Dec15 | Jan16 | Feb16 | Mar16 | Apr16 | May16 | Jun16 | Jul16 | Aug16 |
| Unemplymnt Rate | 3.7 | 3.6 | 3.5 | 3.4 | 3.2 | 3.4 | 3.3 | 3.5 | 3.2 | 3.2 | 3.6 | 3.9 | 3.8 |
| Unemployment | 17,909 | 17,343 | 17,196 | 16,909 | 15,817 | 16,690 | 16,362 | 17,205 | 15,692 | 15,796 | 18,254 | 19,524 | 19,172 |
| Employment | 468,297 | 468,701 | 471,871 | 474,964 | 475,502 | 473,721 | 478,820 | 479,663 | 482,127 | 484,007 | 483,868 | 486,557 | 488,412 |
| Labor Force | 486,206 | 486,044 | 489,067 | 491,873 | 491,319 | 490,411 | 495,182 | 496,868 | 497,819 | 499,803 | 502,122 | 506,081 | 507,584 |
7. Education Infrastructure go top
7.1. Component School District Characteristics go top
Districts in this metro. Updated periodically. See related School District interactive table.
| District Name | City Name | District Code | Locale Code | County | State | 2012-13 Enrollment | 2013 Total Population | Grade Relevant Pop Ages 5-17 |
| Aledo ISD | Aledo | 4807780 | 41 | 48367 | TX | 4,733 | 21,312 | 4,990 |
| Allen ISD | Allen | 4807890 | 21 | 48085 | TX | 19,894 | 89,412 | 20,996 |
| Alvarado ISD | Alvarado | 4800011 | 41 | 48251 | TX | 3,456 | 18,048 | 3,463 |
| Alvord ISD | Alvord | 4808100 | 42 | 48497 | TX | 704 | 3,749 | 717 |
| Anna ISD | Anna | 4808340 | 31 | 48085 | TX | 2,527 | 12,242 | 2,647 |
| Argyle ISD | Argyle | 4808670 | 41 | 48121 | TX | 1,907 | 8,533 | 2,137 |
| Arlington ISD | Arlington | 4808700 | 11 | 48439 | TX | 65,001 | 360,760 | 68,697 |
| Aubrey ISD | Aubrey | 4808910 | 41 | 48121 | TX | 2,006 | 9,646 | 2,060 |
| Avalon ISD | Avalon | 4809030 | 42 | 48139 | TX | 321 | 852 | 155 |
| Azle ISD | Azle | 4809200 | 21 | 48439 | TX | 5,930 | 38,246 | 6,760 |
| Birdville ISD | Haltom City | 4810230 | 21 | 48439 | TX | 24,190 | 138,468 | 24,941 |
| Bland ISD | Merit | 4810350 | 42 | 48231 | TX | 619 | 3,270 | 712 |
| Blue Ridge ISD | Blue Ridge | 4810590 | 42 | 48085 | TX | 658 | 3,507 | 644 |
| Boles ISD | Quinlan | 4810740 | 41 | 48231 | TX | 531 | 696 | 193 |
| Boyd ISD | Boyd | 4811010 | 42 | 48497 | TX | 1,161 | 5,945 | 1,013 |
| Bridgeport ISD | Bridgeport | 4811340 | 41 | 48497 | TX | 2,205 | 12,430 | 2,299 |
| Brock ISD | Brock | 4811460 | 42 | 48367 | TX | 1,003 | 4,377 | 861 |
| Burleson ISD | Burleson | 4812180 | 21 | 48251 | TX | 10,581 | 53,935 | 11,002 |
| Caddo Mills ISD | Caddo Mills | 4812390 | 42 | 48231 | TX | 1,558 | 6,539 | 1,425 |
| Campbell ISD | Campbell | 4812660 | 42 | 48231 | TX | 368 | 2,248 | 377 |
| Carroll ISD | Southlake | 4813020 | 21 | 48439 | TX | 7,711 | 29,463 | 8,469 |
| Carrollton-Farmers Branch ISD | Carrollton | 4813050 | 21 | 48113 | TX | 26,385 | 178,638 | 28,507 |
| Castleberry ISD | Fort Worth | 4813170 | 21 | 48439 | TX | 3,814 | 20,545 | 4,107 |
| Cedar Hill ISD | Cedar Hill | 4813230 | 21 | 48113 | TX | 8,258 | 47,521 | 10,688 |
| Celeste ISD | Celeste | 4813260 | 42 | 48231 | TX | 475 | 2,390 | 492 |
| Celina ISD | Celina | 4813290 | 41 | 48085 | TX | 2,035 | 9,650 | 2,260 |
| Chico ISD | Chico | 4813800 | 42 | 48497 | TX | 589 | 3,659 | 640 |
| Cleburne ISD | Cleburne | 4814310 | 41 | 48251 | TX | 6,622 | 38,469 | 7,319 |
| Commerce ISD | Commerce | 4814820 | 41 | 48231 | TX | 1,573 | 11,060 | 1,661 |
| Community ISD | Nevada | 4814850 | 41 | 48085 | TX | 1,637 | 9,851 | 2,014 |
| Coppell ISD | Coppell | 4815210 | 21 | 48113 | TX | 10,999 | 46,528 | 11,377 |
| Crandall ISD | Crandall | 4815510 | 41 | 48257 | TX | 3,034 | 12,583 | 2,841 |
| Crowley ISD | Crowley | 4815910 | 11 | 48439 | TX | 15,060 | 90,877 | 19,300 |
| Dallas ISD | Dallas | 4816230 | 11 | 48113 | TX | 158,932 | 1,069,448 | 190,136 |
| Decatur ISD | Decatur | 4816500 | 32 | 48497 | TX | 3,027 | 15,044 | 2,959 |
| Denton ISD | Denton | 4816740 | 12 | 48121 | TX | 25,775 | 173,834 | 28,250 |
| Desoto ISD | Desoto | 4816860 | 21 | 48113 | TX | 8,899 | 55,409 | 12,223 |
| Duncanville ISD | Duncanville | 4817640 | 21 | 48113 | TX | 13,271 | 72,353 | 15,244 |
| Eagle Mt-Saginaw ISD | Fort Worth | 4817700 | 11 | 48439 | TX | 17,728 | 83,827 | 18,172 |
| Ennis ISD | Ennis | 4818540 | 41 | 48139 | TX | 5,790 | 27,667 | 5,680 |
| Everman ISD | Everman | 4818810 | 21 | 48439 | TX | 5,402 | 23,628 | 5,401 |
| Farmersville ISD | Farmersville | 4819080 | 31 | 48085 | TX | 1,474 | 8,224 | 1,659 |
| Ferris ISD | Ferris | 4819170 | 41 | 48139 | TX | 2,408 | 9,970 | 2,185 |
| Forney ISD | Forney | 4819560 | 41 | 48257 | TX | 8,568 | 33,596 | 8,222 |
| Fort Worth ISD | Fort Worth | 4819700 | 11 | 48439 | TX | 83,503 | 493,238 | 91,520 |
| Frisco ISD | Frisco | 4820010 | 21 | 48085 | TX | 42,707 | 178,493 | 40,585 |
| Garland ISD | Garland | 4820340 | 21 | 48113 | TX | 58,059 | 289,593 | 61,166 |
| Garner ISD | Weatherford | 4820370 | 42 | 48367 | TX | 190 | 3,784 | 287 |
| Glen Rose ISD | Glen Rose | 4820850 | 42 | 48425 | TX | 1,688 | 8,585 | 1,656 |
| Godley ISD | Godley | 4820960 | 42 | 48251 | TX | 1,672 | 7,260 | 1,613 |
| Granbury ISD | Granbury | 4821390 | 32 | 48221 | TX | 6,537 | 49,854 | 7,634 |
| Grand Prairie ISD | Grand Prairie | 4821420 | 21 | 48113 | TX | 26,921 | 127,116 | 29,027 |
| Grandview ISD | Grandview | 4821540 | 42 | 48251 | TX | 1,142 | 4,799 | 1,037 |
| Grapevine-Colleyville ISD | Grapevine | 4821660 | 21 | 48439 | TX | 13,388 | 79,102 | 15,589 |
| Greenville ISD | Greenville | 4821720 | 32 | 48231 | TX | 4,661 | 31,196 | 5,452 |
| Highland Park ISD | Dallas | 4823250 | 21 | 48113 | TX | 6,848 | 34,513 | 8,137 |
| Hurst-Euless-Bedford ISD | Bedford | 4824060 | 21 | 48439 | TX | 21,814 | 145,254 | 23,231 |
| Irving ISD | Irving | 4824420 | 12 | 48113 | TX | 35,030 | 179,018 | 34,262 |
| Italy ISD | Italy | 4824450 | 42 | 48139 | TX | 549 | 2,974 | 584 |
| Joshua ISD | Joshua | 4824930 | 41 | 48251 | TX | 4,906 | 24,393 | 5,092 |
| Kaufman ISD | Kaufman | 4825200 | 32 | 48257 | TX | 3,758 | 18,072 | 3,717 |
| Keene ISD | Keene | 4825230 | 31 | 48251 | TX | 905 | 5,129 | 959 |
| Keller ISD | Keller | 4825260 | 11 | 48439 | TX | 33,367 | 159,266 | 37,976 |
| Kemp ISD | Kemp | 4825320 | 42 | 48257 | TX | 1,457 | 9,776 | 1,631 |
| Kennedale ISD | Kennedale | 4825500 | 21 | 48439 | TX | 3,163 | 18,935 | 3,785 |
| Krum ISD | Krum | 4825980 | 31 | 48121 | TX | 1,893 | 8,874 | 1,847 |
| Lake Dallas ISD | Lake Dallas | 4826430 | 21 | 48121 | TX | 4,015 | 23,329 | 4,902 |
| Lake Worth ISD | Lake Worth | 4826490 | 21 | 48439 | TX | 3,257 | 16,636 | 3,235 |
| Lancaster ISD | Lancaster | 4826670 | 21 | 48113 | TX | 6,536 | 38,077 | 8,638 |
| Lewisville ISD | Flower Mound | 4827300 | 21 | 48121 | TX | 52,528 | 294,541 | 60,889 |
| Lipan ISD | Lipan | 4827630 | 43 | 48221 | TX | 312 | 1,996 | 306 |
| Little Elm ISD | Little Elm | 4827720 | 21 | 48121 | TX | 6,400 | 31,315 | 7,005 |
| Lone Oak ISD | Lone Oak | 4828020 | 42 | 48231 | TX | 921 | 4,383 | 877 |
| Lovejoy ISD | Allen | 4828380 | 21 | 48085 | TX | 3,649 | 13,901 | 3,496 |
| Mabank ISD | Mabank | 4828680 | 33 | 48257 | TX | 3,401 | 19,287 | 3,248 |
| Mansfield ISD | Mansfield | 4828920 | 21 | 48439 | TX | 32,879 | 146,617 | 35,133 |
| Maypearl ISD | Maypearl | 4829580 | 42 | 48139 | TX | 1,010 | 4,804 | 1,087 |
| Mckinney ISD | Mckinney | 4829850 | 22 | 48085 | TX | 24,443 | 121,290 | 27,660 |
| Melissa ISD | Melissa | 4830120 | 22 | 48085 | TX | 1,694 | 6,930 | 1,614 |
| Mesquite ISD | Mesquite | 4830390 | 21 | 48113 | TX | 39,127 | 175,907 | 39,043 |
| Midlothian ISD | Midlothian | 4830600 | 21 | 48139 | TX | 7,560 | 33,960 | 7,772 |
| Milford ISD | Milford | 4830780 | 42 | 48139 | TX | 230 | 1,329 | 273 |
| Millsap ISD | Millsap | 4830870 | 42 | 48367 | TX | 794 | 4,096 | 666 |
| Northwest ISD | Justin | 4833180 | 11 | 48121 | TX | 17,811 | 81,321 | 17,779 |
| Palmer ISD | Palmer | 4834110 | 41 | 48139 | TX | 1,097 | 5,717 | 1,228 |
| Paradise ISD | Paradise | 4834260 | 42 | 48497 | TX | 1,085 | 4,988 | 1,000 |
| Peaster ISD | Weatherford | 4834500 | 42 | 48367 | TX | 1,020 | 4,620 | 981 |
| Pilot Point ISD | Pilot Point | 4834920 | 31 | 48121 | TX | 1,518 | 8,653 | 1,719 |
| Plano ISD | Plano | 4835100 | 11 | 48085 | TX | 55,185 | 353,951 | 65,316 |
| Ponder ISD | Ponder | 4835310 | 42 | 48121 | TX | 1,246 | 5,963 | 1,290 |
| Poolville ISD | Poolville | 4835340 | 42 | 48367 | TX | 512 | 3,073 | 565 |
| Princeton ISD | Princeton | 4835850 | 22 | 48085 | TX | 3,436 | 15,874 | 3,345 |
| Prosper ISD | Prosper | 4836000 | 41 | 48085 | TX | 5,505 | 17,432 | 4,316 |
| Quinlan ISD | Quinlan | 4836240 | 41 | 48231 | TX | 2,534 | 18,019 | 2,994 |
| Red Oak ISD | Red Oak | 4836660 | 21 | 48139 | TX | 5,634 | 26,305 | 5,671 |
| Richardson ISD | Richardson | 4837020 | 11 | 48113 | TX | 38,043 | 225,934 | 38,629 |
| Rio Vista ISD | Rio Vista | 4837200 | 42 | 48251 | TX | 815 | 4,117 | 811 |
| Rockwall ISD | Rockwall | 4837650 | 21 | 48397 | TX | 14,486 | 68,825 | 15,134 |
| Royse City ISD | Royse City | 4838220 | 41 | 48397 | TX | 4,905 | 21,708 | 4,848 |
| Sanger ISD | Sanger | 4839180 | 41 | 48121 | TX | 2,665 | 14,173 | 2,860 |
| Scurry-Rosser ISD | Scurry | 4839570 | 42 | 48257 | TX | 1,005 | 4,427 | 896 |
| Slidell ISD | Slidell | 4840470 | 42 | 48497 | TX | 251 | 2,009 | 347 |
| Springtown ISD | Springtown | 4841280 | 31 | 48367 | TX | 3,459 | 19,160 | 3,602 |
| Sunnyvale ISD | Sunnyvale | 4841880 | 41 | 48113 | TX | 1,291 | 5,357 | 1,109 |
| Terrell ISD | Terrell | 4842450 | 32 | 48257 | TX | 4,223 | 26,099 | 4,649 |
| Tolar ISD | Tolar | 4842900 | 42 | 48221 | TX | 651 | 2,696 | 544 |
| Venus ISD | Venus | 4844010 | 31 | 48251 | TX | 1,902 | 9,804 | 1,947 |
| Waxahachie ISD | Waxahachie | 4844730 | 21 | 48139 | TX | 7,651 | 42,880 | 8,085 |
| Weatherford ISD | Weatherford | 4844800 | 31 | 48367 | TX | 7,636 | 49,152 | 8,478 |
| White Settlement ISD | White Settlement | 4845540 | 41 | 48439 | TX | 6,539 | 33,240 | 6,526 |
| Wolfe City ISD | Wolfe City | 4846350 | 43 | 48231 | TX | 612 | 3,097 | 551 |
| Wylie ISD | Wylie | 4846530 | 21 | 48085 | TX | 13,426 | 61,995 | 14,278 |
Number of districts: 112 ... Total enrollment: 1,237,876
All school districts interactive tables General Demographics | Social | Economic | Housing
All school districts enrollment & adminstratively reported data interactive table.
7.2. Component Higher Education Institution Characteristics go top
2014-15 School Year. Extended detail Available in subscription edition.
| Institution | City Name | Code | Level | Total UG Enrollment | Fulltime UG Enrollment | Total Grad Enrollment | Fulltime Grad Enrollment |
| Amberton University | Garland, TX | 222628 | 7 | 245 | 21 | 1,136 | 76 |
| Argosy University-Dallas | Farmers Branch, TX | 442222 | 9 | 271 | 33 | 225 | 51 |
| Arlington Baptist College | Arlington, TX | 222877 | 7 | 233 | 178 | 17 | 12 |
| Arlington Career Institute | Grand Prairie, TX | 222886 | 4 | 204 | 146 | 0 | 0 |
| Aviation Institute of Maintenance-Dallas | Irving, TX | 441788 | 4 | 359 | 348 | 0 | 0 |
| Brookhaven College | Farmers Branch, TX | 223524 | 3 | 12,403 | 2,162 | 0 | 0 |
| Brown Mackie College-Dallas | Bedford, TX | 482954 | 5 | 432 | 432 | 0 | 0 |
| Cedar Valley College | Lancaster, TX | 223773 | 3 | 6,759 | 1,474 | 0 | 0 |
| Central Texas Commercial College | Dallas, TX | 376950 | 3 | 11 | 11 | 0 | 0 |
| Collin County Community College District | McKinney, TX | 247834 | 3 | 27,991 | 9,899 | 0 | 0 |
| Concorde Career College-Grand Prairie | Grand Prairie, TX | 441742 | 3 | 987 | 987 | 0 | 0 |
| Concorde Career Institute-Dallas | Dallas, TX | 460181 | 3 | 555 | 555 | 0 | 0 |
| Court Reporting Institute of Dallas | Dallas, TX | 224183 | 3 | 38 | 38 | 0 | 0 |
| Criswell College | Dallas, TX | 475608 | 7 | 256 | 139 | 87 | 29 |
| Dallas Baptist University | Dallas, TX | 224226 | 9 | 3,457 | 2,397 | 1,988 | 665 |
| Dallas Christian College | Dallas, TX | 224244 | 5 | 309 | 232 | 0 | 0 |
| Dallas Institute of Funeral Service | Dallas, TX | 224271 | 3 | 128 | 128 | 0 | 0 |
| Dallas Nursing Institute | Dallas, TX | 437732 | 3 | 160 | 117 | 0 | 0 |
| DeVry University-Texas | Irving, TX | 482635 | 7 | 1,987 | 826 | 868 | 237 |
| Eastfield College | Mesquite, TX | 224572 | 3 | 15,112 | 3,358 | 0 | 0 |
| El Centro College | Dallas, TX | 224615 | 3 | 10,549 | 1,764 | 0 | 0 |
| Everest College-Arlington | Arlington, TX | 443854 | 3 | 505 | 478 | 0 | 0 |
| Everest College-Dallas | Dallas, TX | 442790 | 3 | 712 | 552 | 0 | 0 |
| Everest College-Fort Worth | Fort Worth, TX | 445197 | 3 | 204 | 182 | 0 | 0 |
| Everest College-Fort Worth South | Ft Worth, TX | 460358 | 3 | 516 | 475 | 0 | 0 |
| Fortis Institute-Grand Prairie | Grand Prairie, TX | 458478 | 4 | 260 | 260 | 0 | 0 |
| Golf Academy of America-Farmers Branch | Farmers Branch, TX | 476337 | 3 | 80 | 76 | 0 | 0 |
| ITT Technical Institute-Arlington | Arlington, TX | 225849 | 5 | 595 | 469 | 0 | 0 |
| ITT Technical Institute-DeSoto | DeSoto, TX | 459657 | 5 | 263 | 212 | 0 | 0 |
| ITT Technical Institute-Richardson | Richardson, TX | 434052 | 5 | 708 | 532 | 0 | 0 |
| KD College Conservatory of Film and Dramatic Arts | Dallas, TX | 225991 | 3 | 162 | 162 | 0 | 0 |
| Kaplan College-Arlington | Arlington, TX | 458690 | 3 | 399 | 399 | 0 | 0 |
| Kaplan College-Dallas | Dallas, TX | 382896 | 3 | 435 | 435 | 0 | 0 |
| Kaplan College-Fort Worth | Fort Worth, TX | 445328 | 3 | 284 | 284 | 0 | 0 |
| King's University | Southlake, TX | 439701 | 9 | 473 | 202 | 219 | 24 |
| Le Cordon Bleu College of Culinary Arts-Dallas | Dallas, TX | 452063 | 3 | 909 | 909 | 0 | 0 |
| Lincoln College of Technology-Grand Prairie | Grand Prairie, TX | 226277 | 4 | 947 | 947 | 0 | 0 |
| Messenger College | Euless, TX | 417752 | 5 | 166 | 79 | 0 | 0 |
| Mountain View College | Dallas, TX | 226930 | 3 | 8,950 | 1,962 | 0 | 0 |
| National American University-Lewisville | Lewisville, TX | 482316 | 5 | 213 | 5 | 0 | 0 |
| National American University-Mesquite | Mesquite, TX | 478014 | 5 | 203 | 10 | 0 | 0 |
| National American University-Richardson | Richardson, TX | 482334 | 5 | 242 | 1 | 0 | 0 |
| North Lake College | Irving, TX | 227191 | 3 | 10,744 | 2,356 | 0 | 0 |
| Northwood University-Texas | Cedar Hill, TX | 227243 | 7 | 278 | 159 | 52 | 7 |
| Parker University | Dallas, TX | 243823 | 9 | 229 | 156 | 748 | 714 |
| Paul Quinn College | Dallas, TX | 227429 | 5 | 273 | 260 | 0 | 0 |
| Remington College-Dallas Campus | Garland, TX | 223463 | 5 | 822 | 822 | 0 | 0 |
| Remington College-Fort Worth Campus | Fort Worth, TX | 377111 | 3 | 435 | 435 | 0 | 0 |
| Richland College | Dallas, TX | 227766 | 3 | 19,343 | 4,591 | 0 | 0 |
| Sanford-Brown College-Dallas | Dallas, TX | 404514 | 4 | 490 | 490 | 0 | 0 |
| South University-The Art Institute of Dallas | Dallas, TX | 224776 | 7 | 1,139 | 932 | 16 | 0 |
| South University-The Art Institute of Fort Worth | Fort Worth, TX | 468015 | 5 | 329 | 276 | 0 | 0 |
| Southern Methodist University | Dallas, TX | 228246 | 9 | 6,391 | 6,193 | 4,881 | 2,549 |
| Southwestern Adventist University | Keene, TX | 228468 | 7 | 797 | 678 | 13 | 9 |
| Southwestern Assemblies of God University | Waxahachie, TX | 228325 | 9 | 1,666 | 1,445 | 318 | 50 |
| Southwestern Christian College | Terrell, TX | 228486 | 5 | 164 | 153 | 0 | 0 |
| Tarrant County College District | Fort Worth, TX | 228547 | 3 | 50,595 | 15,764 | 0 | 0 |
| Texas A & M University-Commerce | Commerce, TX | 224554 | 9 | 7,374 | 5,482 | 4,737 | 1,309 |
| Texas Christian University | Fort Worth, TX | 228875 | 9 | 8,647 | 8,338 | 1,386 | 1,214 |
| Texas Wesleyan University | Fort Worth, TX | 229160 | 9 | 1,687 | 1,424 | 689 | 457 |
| Texas Woman's University | Denton, TX | 229179 | 9 | 9,680 | 6,796 | 5,391 | 2,036 |
| The College of Health Care Professions-Dallas | Dallas, TX | 480824 | 3 | 152 | 152 | 0 | 0 |
| The College of Health Care Professions-Fort Worth | Fort Worth, TX | 480833 | 3 | 310 | 310 | 0 | 0 |
| The University of Texas at Arlington | Arlington, TX | 228769 | 9 | 29,883 | 15,957 | 9,857 | 3,984 |
| The University of Texas at Dallas | Richardson, TX | 228787 | 9 | 14,300 | 11,630 | 8,795 | 5,962 |
| University of Dallas | Irving, TX | 224323 | 9 | 1,327 | 1,313 | 1,221 | 406 |
| University of North Texas | Denton, TX | 227216 | 9 | 29,758 | 23,762 | 6,728 | 3,036 |
| University of North Texas at Dallas | Dallas, TX | 484905 | 7 | 2,251 | 1,389 | 324 | 69 |
| University of Texas Southwestern Medical Center | Dallas, TX | 228635 | 9 | 5 | 5 | 2,336 | 1,725 |
| Wade College | Dallas, TX | 226879 | 5 | 207 | 159 | 0 | 0 |
| Weatherford College | Weatherford, TX | 229799 | 3 | 5,613 | 2,193 | 0 | 0 |
| West Coast University-Dallas | Dallas, TX | 477039 | 5 | 428 | 398 | 0 | 0 |
Number of institutions: 72 ... Total undergraduate enrollment: 304,989
Levels: 3-Assoc degree, 4-at least 2, but < 4 years, 5-Bach degree, 6-Postbacc cert, 7 Masters degree, 8 Post-masters cert, 9 Doctors degree
8. GeoPolitics go top
Updated periodically. Voting patterns, citizen voting age population, state legislative districts, congressional districts .. in this metro.
Available in subscription edition.
Notes
• All data are for current vintage county and metro definition.
• Developed by ProximityOne -- Metro Reports (888-364-7656)
• Data sources: ProximityOne, Census Bureau, Bureau of Economic Analysis, Bureau of Labor Statistics, Federal Housing Finance Agency,
National Center for Education Statistics.
Updates go top
The subscription edition updates frequently. Selected items are listed below. Register to receive update notifications.
• Overview lead narrative; quarterly & annual/March.
• Housing Price Index (section 5.4) quarterly.
• Establishments, employment & earnings (section 6.6) quarterly.
• Economic profile and personal income (section 6.1) annual/November.
• Labor market situation (section 6.7) monthly.
• Residential construction; units authorized & value (section 5.3.) monthly.
• Population by county; annual series 2010-2016 (section 4.2.) annual/July.
• Population by county; links for individual counties (section 4.2.) annual/July.
-- includes annual data 2010-2016.
-- includes components of change; race/origin; single year of age; age group summaries.
• Total population and components of change; annual/March.
• Census tracts overview section; annual/December.
• General Demographics section updated/extended; annual/December.
• Gross Domestic Product section; annual/September.
• Higher education institutions; annual/February.
• Metro & county demographic component detailed annual estimates; annual/March.
• School districts in metro & K-12 enrollment; annual/August.
More about schedule and upcoming events ... Calendar ... Upcoming Events ... Find Event
Terms of Use go top
Situation & Outlook Reports are a proprietary resource developed by ProximityOne. There is no warranty of any type associated with any aspect of this report. The user of this document is solely responsible to any use, direct or indirect, that might be made of this document.
Related Resources go top
• Metros main page
• Current estimates and projections: states to 2030, counties & metros to 2020 by age, counties & states to 2060.
• Making Custom Metropolitan Area Maps
• Rental Market Conditions by Metropolitan Area
• Metro Gross Domestic Product
• Housing Price Index
• Establishments, Employment & Earnings
• Regional Economic Information System
• ACS 2014 1-year General Demographics ... Social Characteristics ... Economic Characteristics ... Housing Characteristics
Using this Document go top
The Situation & Outlook Report, a component of the Situation & Outlook, is a core ProximityOne information resource providing insights into characteristics and trends of counties, metropolitan areas, states and the U.S. The Report also provides a gateway to drill-down demographic, economic and business data for smaller geographic areas.
Metropolitan areas include approximately 94 percent of the U.S. population -- 85 percent in metropolitan statistical areas (MSAs) and 9 percent in micropolitan statistical areas (MISAs).
About Metropolitan Areas & Principal Cities -- scroll section go top
Metropolitan Areas are designated by OMB ("Standards for Delineating Metropolitan and Micropolitan Statistical Areas") based
mainly on Census Bureau-sourced data.
Metropolitan areas are defined as Metropolitan Statistical Areas (MSA) and Micropolitan Statistical Areas (MISA).
MSAs and MISAs are also referred to a Core-Based Statistical Areas (CBSAs).
Contiguous CBSAs are defined as Combined Statistical Areas (CSA).
By definition, metropolitan areas are comprised of one or more contiguous counties. Metropolitan areas are not single cities and typically include many cities. Metropolitan areas are comprised of urban and rural areas and often have large expanses of rural territory. A business and demographic-economic synergy exists within each metro; metros often interact with adjacent metros. The demographic-economic make-up of metros vary widely and change often. See more about metros.
Principal Cities. The largest city in each metropolitan or micropolitan statistical area is designated a "principal city." Principal cities are designated by OMB based on Census-sourced data. Additional cities qualify as principal cities if specified requirements are met concerning population size and employment. The title of each metropolitan or micropolitan statistical area consists of the names of up to three of its principal cities and the name of each state into which the metropolitan or micropolitan statistical area extends. Titles of metropolitan divisions also typically are based on principal city names but in certain cases consist of county names.
One or more principal cities are designated within each Metropolitan Statistical Area (MSA) and Micropolitan Statistical Area (MISA). The term "principal city" is defined in the OMB "Standards for Delineating Metropolitan and Micropolitan Statistical Areas." A principal city is an OMB designation applied to one or more incorporated places and/or census designated places (CDPs). The OMB standards designate a Principal City (or Cities) of a Core-Based Statistical Area (CBSA) as determined by:
a) The largest incorporated place with a 2010 Census population of at least 10,000 in the CBSA or,
if no incorporated place of at least 10,000 population is present in the CBSA,
the largest incorporated place or census designated place in the CBSA; and
b) Additional places with 2010 Census population of at least 250,000 or in which 100,000 or more persons work; and
c) Additional places with 2010 Census population of 50,000-250,000,
and number of workers working in the place meets or exceeds the number of workers living in the place; and
d) Additional places with 2010 Census population of 10,000-50,000, and at least one-third the population size of the largest place,
and in which the number of workers working in the place meets or exceeds the number of workers living in the place.
ProximityOne User Group go top
Join the ProximityOne User Group to keep up-to-date with new developments relating to metros and component geography decision-making information resources. Receive updates and access to tools and resources available only to members. Use this form to join the User Group.
Support Using these Resources go top
Learn more about accessing and using demographic-economic data and related analytical tools. Join us in a Data Analytics Lab session. There is no fee for these one-hour Web sessions. Each informal session is focused on a specific topic. The open structure also provides for Q&A and discussion of application issues of interest to participants.
Additional Information go top
ProximityOne develops geographic-demographic-economic data and analytical tools and helps organizations knit together and use diverse data in a decision-making and analytical framework. We develop custom demographic/economic estimates and projections, develop geographic and geocoded address files, and assist with impact and geospatial analyses. Wide-ranging organizations use our tools (software, data, methodologies) to analyze their own data integrated with other data. Follow ProximityOne on Twitter at www.twitter.com/proximityone. Contact us (888-364-7656) with questions about data covered in this section or to discuss custom estimates, projections or analyses for your areas of interest.
Copyright © 2018 ProximityOne