
|
|
|
-- using GIS resources to create custom metropolitan area maps This section reviews tools that you can use to develop your own map(s) that show U.S. metropolitan areas of interest. See more about using Geographic Information System (GIS) tools. The metro boundary shapefile (more about this shapefile) used in the metros GIS project described here creates metro boundaries that are very precise. The GIS resources enable you to view/show the metro boundaries in context with roads, landmarks and other geography. Flexibly add labels. Create pattern views. Add your own data. Metro maps can be saved as a graphic and used in any manner. Metro mapping features the latest vintage metro definitions (February 2013) and latest smoothed boundary shapefiles (July 2014). There are no fees to use resources described in this section. Atlanta, GA Metro by County -- create similar map view for any metro 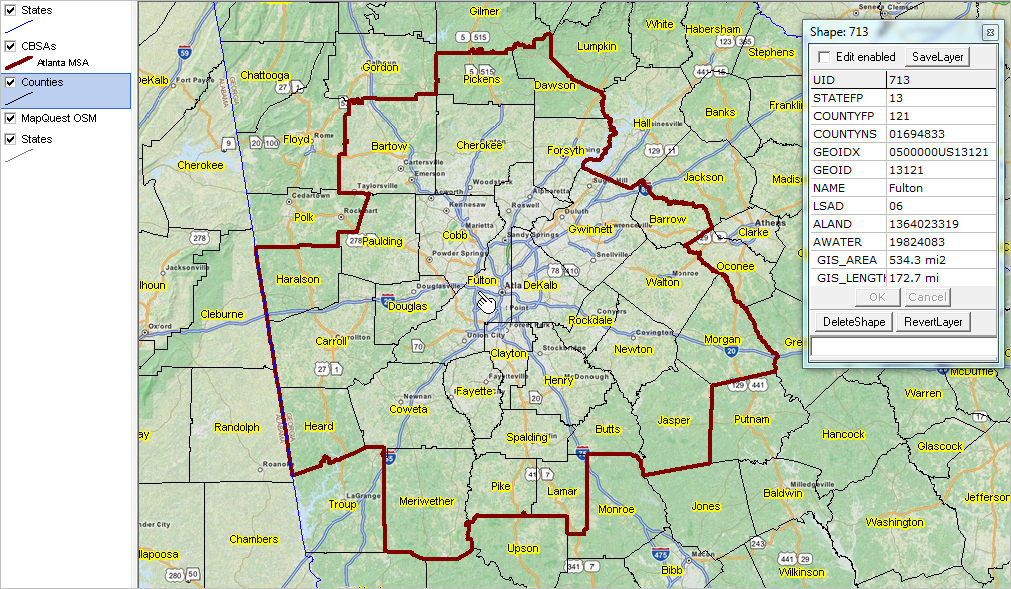 Atlanta metro: red/brown bold boundary; counties black thin boundary. Click graphic for larger view with county name labeling; illustrates mini-profile of component county (Fulton). See more illustrative views below. Steps to Develop Custom Metro Maps (requires Windows computer with Internet connection) 1. Install the ProximityOne CV XE GIS ... run the CV XE GIS installer ... take all defaults during installation 2. Download the U.S. metros GIS project fileset ... requires ProximityOne User Group ID (join now, no fee) ... unzip U.S. Metros GIS project files to local folder c:\metromaps 3. Open the c:\metromaps\metromaps1.gis project ... after completing the above steps, click File>Open>Dialog ... open the file named c:\metromaps\metromaps.gis 4. Done. The start-up view is shown below with additional instructions. ProximityOne User Group A supplementary and different set of data, software and analytical resources are provided as a part of the ProximityOne User Group. Members may download and use selected resources on their own computers. Join now ... there is no fee to participate. Using the Metro Maps Projects There are three metro GIS projects included with the ZIP file. Each GIS project includes the same set of layers/shapefiles. Single Metro -- metromaps1.gis When the c:\metromaps\metromaps1.gis is opened, the view shown below appears. 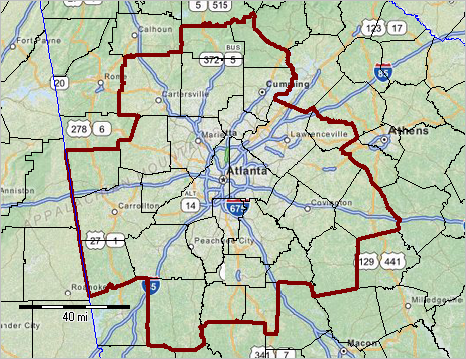 Click graphic for larger view. All U.S. Metropolitan Statistical Areas -- metromaps2.gis When the c:\metromaps\metromaps2.gis is opened, the view shown below appears.  Click graphic for larger view. All CBSAs in a Selected State -- metromaps3.gis When the c:\metromaps\metromaps3.gis is opened, the view shown below appears. 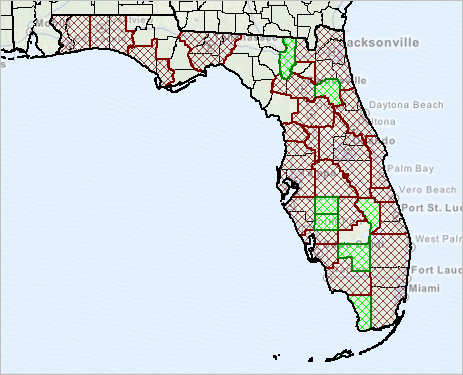 Click graphic for larger view. Saving/Publishing a Map View When you have a view that you want to save, click the Save to Image button on the toolbar. You will then be prompted for the folder and filename. Once the graphic has been saved to a folder it can be used just as any other graphic. Saving, Closing and Opening Projects If CV XE GIS is closed with no changes made to the project settings are saved. Reopening the project will create the same start-up view as shown above. Repeat the steps to create views for other cities. If you have made adjustments to the project and want to save it, to be reopened later with the same view, use File>SaveAs to save a new project name. It is recommended that you do not save the project with the same name as you will not be able to recall the original start-up view. About the CBSA Shapefile Metro mapping features the latest vintage metro -- Core-Based Statistical Areas (CBSAs) -- definitions (February 2013) and latest smoothed boundary shapefile (July 2014). CBSAs are the combined set of Metropolitan Statistical Areas (MSAs) and Micropolitan Statistical Areas (MISAs). There are no demographic-economic subject matter items included in this version of the shapefile. Fields which be used in queries include the following: • CSAFP -- Combined Statistical Area FIPS code(C3) • CBSAFP -- Core-Based Statistical Area FIPS code (C5) • GEOIDX -- Extended GEOID (C14) • GEOID -- CBSA code (C5) • NAME -- CBSA Name (C100) • LSAD -- Legal Statistical Area Description (C2): M1: MSA; M2:MISA • ALAND -- Land Area, square meters (N14) • AWATER -- Water Area, suare meters (N14) Support & DMI Web Sessions Learn more about using resources described in this section. Join us in a Decision-Making Information Web session. There is no fee for these one-hour Web sessions. Each informal session is focused on a specific topic. The open structure also provides for Q&A and discussion of application issues of interest to participants. We can address your specific questions about using metro and county demographic economic data and related applications. Additional Information ProximityOne develops geographic-demographic-economic data and analytical tools and helps organizations knit together and use diverse data in a decision-making and analytical framework. We develop custom demographic/economic estimates and projections, develop geographic and geocoded address files, and assist with impact and geospatial analyses. Wide-ranging organizations use our tools (software, data, methodologies) to analyze their own data integrated with other data. Follow ProximityOne on Twitter at www.twitter.com/proximityone. Contact ProximityOne (888-364-7656) with questions about data covered in this section or to discuss custom estimates, projections or analyses for your areas of interest. |
|
|